NOT LISTED FOR SALE

Estimated Value: $235,456 - $269,000

3 Beds
2 Baths
1,236 Sq Ft
$206/Sq Ft Est. Value

Last Sold August 18, 2015

Last sale price $159,000 $129 Per Sq Ft

Est. 60% increase in value since last sale

Current estimated payment $1,732/month

41 Days on Market

Highlights

  • Deck
  • Ranch Style House
  • Garage
  • Hickory Grove Elementary School Rated A
  • Fenced Yard

About This Home

As of August 2015

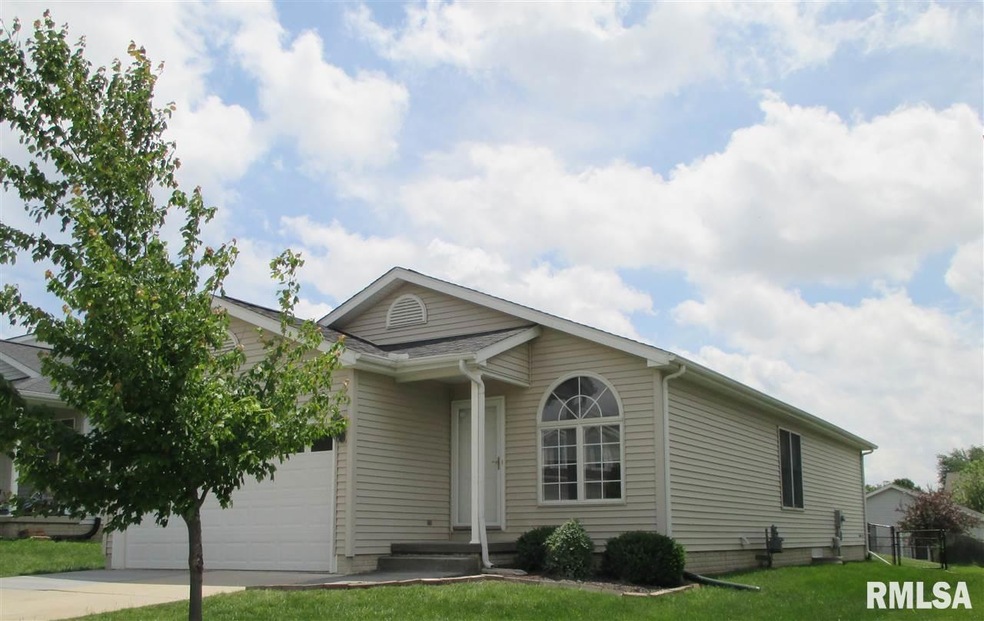
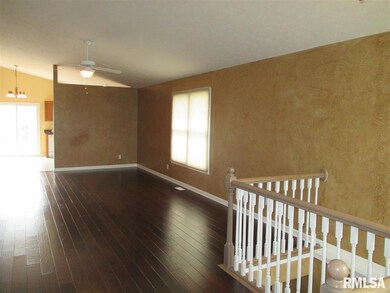
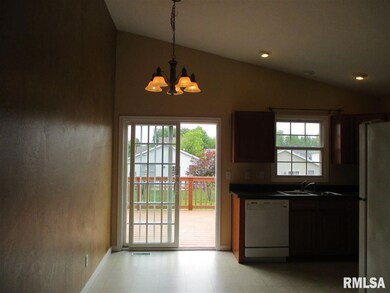
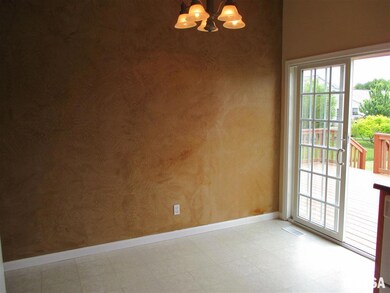
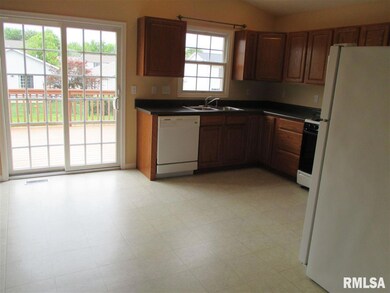
Affordable living in an updated, newer home in Dunlap/Hickory Grove school district. This 3 bedroom 2 bath property has beautiful wood flooring and faux-finished walls, a master bath, an attached 2 car garage, a composite deck and a fenced yard. Full basement ready to be finished. Close to paved walking and biking paths as well as the Rock Island Trail.

Last Agent to Sell the Property

Pam Skehan

Jim Maloof Realty, Inc. License #475125625 Listed on: 05/30/2015

Jim Maloof Realty, Inc.

Last Buyer's Agent

Carolyn Catton

Realty Executives Acclaimed License #471002194

Realty Executives Acclaimed

Home Details

Home Type

  • Single Family

Est. Annual Taxes

  • $4,258

Year Built

  • Built in 2004

Lot Details

  • 6,011

Home Design

  • Ranch Style House

Kitchen

  • Range Hood
  • Microwave
  • Dishwasher

Parking

  • Garage
  • Garage Door Opener

Additional Features

  • 2 Full Bathrooms
  • Deck
  • Fenced Yard
  • Cable TV Available

Home Details

Home Type

Single Family

Est. Annual Taxes

$4,258

Year Built

Built in 2004

Lot Details

0

Listing Details

  • Class: Residential
  • Type: Single Family
  • Style: Ranch
  • Legal Description: Hickory Grove Sub SEc2 NE 1/4 LOT 56 Sec 30-10N-8E
  • Year Built: 2004
  • Special Features: None
  • Property Sub Type: Detached

Interior Features

  • Appliances: Dishwasher, Hood/Fan, Microwave Oven, Refrigerator
  • Interior Amenities: Cable Tv Available, Garage Door Opener(s)
  • Total Bathrooms: 2
  • Total Full Baths: 2
  • Number of Main Level Full Bathrooms: 2
  • Bedrooms: 3
  • Master Bedroom: Dimensions: 13x13, On Level: Main, Flooring: Carpet
  • Basement Foundation: Egress Window, Full
  • Bathroom Master Bedroom: None
  • Bedroom 2: Dimensions: 9x9, On Level: Main, Flooring: Carpet
  • Bedroom 3: Dimensions: 9x7, On Level: Main, Flooring: Carpet
  • Kitchen: Dimensions: 12x14, On Level: Main, Flooring: Vinyl
  • Kitchen Dining: Eat-In Kitchen
  • Laundry: Dimensions: 8x12, On Level: Basement, Flooring: Other
  • Living Room: Dimensions: 25x14, On Level: Main, Flooring: Hardwood
  • Total Basement Sq Ft: 1236
  • Price Per Sq Ft: 128.64
  • Finished Sq Ft: 1236
  • Total Sq Ft: 1236
  • Finished Main Level Sq Ft: 1236

Exterior Features

  • Exterior: Aluminum Siding
  • Exterior Amenities: Deck, Fenced Yard
  • Road Access: Paved
  • Roofing: Shingles

Garage/Parking

  • Garage Parking: Attached
  • Garage Yn: Yes
  • Number Cars: 2

Utilities

  • Heating Cooling: Gas, Forced Air, Central Air
  • Utilities On: Yes
  • Water Sewer: Public Water, Public Sewer

Lot Info

  • Estimated Lot Size: 45x133
  • Lot Description: Level
  • Subdivision: Hickory Grove
  • Geo Subdivision: IL

Tax Info

  • Annual Taxes: 4257.68
  • Parcel Id Number Tax Id: 09-30-205-039
  • Tax Year: 2014

MLS Schools

  • High School School District: Dunlap

Range of Values:

--
Value Increase
--
Percent Increase
--
Adjusted for Inflation
Collateral Analytics

Collateral Analytics Collateral Analytics AVMs (Automated Valuation Model) employ a number of statistical approaches combined with neighborhood-specific comparable selection guarantees the most up-to-date and precise valuations.

Not Available

Collateral Analytics does not have data for the current month. Please view the chart for historical values.

ICE

ICE Mortgage Technology ICE Mortgage Technology’s AVM (Automated Valuation Model) is a state-of-the-art online residential property valuation tool that provides a quick and accurate estimate of the value of almost any home in the U.S.

Not Available

ICE Mortgage Technology does not have data for the current month. Please view the chart for historical values.

First American

First American First American Data & Analytics’ next-generation AVM combines unrivaled data assets with a blended ensemble of valuation models to produce highly accurate, reliable valuations you can trust.

Not Available

First American does not have data for the current month. Please view the chart for historical values.

Quantarium

Quantarium Quantarium’s valuation service, repeatedly proven the industry’s most accurate and comprehensive, is supercharged with a self-learning and auto-tuning AI engine that continually becomes smarter and more accurate as it processes daily inputs from the industry’s leading RE data lake.

Not Available

Quantarium does not have data for the current month. Please view the chart for historical values.

Average Value
Not Available
List Price
Sold Price
Create a Home Valuation Report for This Property
The Home Valuation Report is an in-depth analysis detailing your home's value as well as a comparison with similar homes in the area

Home Values in the Area

Source: Public Records

Average Home Value in this Area


Source: Public Records

Property History

Date Event Price List to Sale Price per Sq Ft Prior Sale
08/18/2015 08/18/15 Sold $159,000 -7.8% $129 / Sq Ft
07/10/2015 07/10/15 Pending -- -- --
05/30/2015 05/30/15 For Sale $172,500 +12.0% $140 / Sq Ft
04/12/2013 04/12/13 Sold $154,000 -7.8% $125 / Sq Ft View Prior Sale
03/21/2013 03/21/13 Pending -- -- --
02/18/2013 02/18/13 For Sale $167,000 +11.4% $135 / Sq Ft
03/16/2012 03/16/12 Sold $149,900 -6.3% $121 / Sq Ft View Prior Sale
02/15/2012 02/15/12 Pending -- -- --
11/01/2011 11/01/11 For Sale $159,900 -- $129 / Sq Ft
Source: RMLS Alliance

Tax History Compared to Growth

Source: Public Records

Tax History

Year Tax Paid Tax Assessment Tax Assessment Total Assessment is a certain percentage of the fair market value that is determined by local assessors to be the total taxable value of land and additions on the property. Land Improvement
2024 $4,685 $61,220 $12,520 $48,700
2023 $4,466 $58,300 $11,920 $46,380
2022 $3,974 $52,050 $11,010 $41,040
2021 $3,811 $49,580 $10,490 $39,090
2020 $3,792 $49,090 $10,390 $38,700
2019 $3,910 $50,610 $10,710 $39,900
2018 $3,961 $51,760 $10,700 $41,060
2017 $4,115 $53,360 $11,030 $42,330
2016 $4,548 $53,360 $11,030 $42,330
2015 $4,258 $51,810 $10,710 $41,100
2014 $3,717 $51,180 $10,580 $40,600
2013 -- $50,680 $10,480 $40,200
Source: Public Records

Agents Affiliated with this Home

  • Section Image
  • Section Image
  • Section Image
  • Section Image
See All Agents

Map

Source: RMLS Alliance

MLS Number: RMAPA1162732

RMLS Alliance

APN: 09-30-205-039