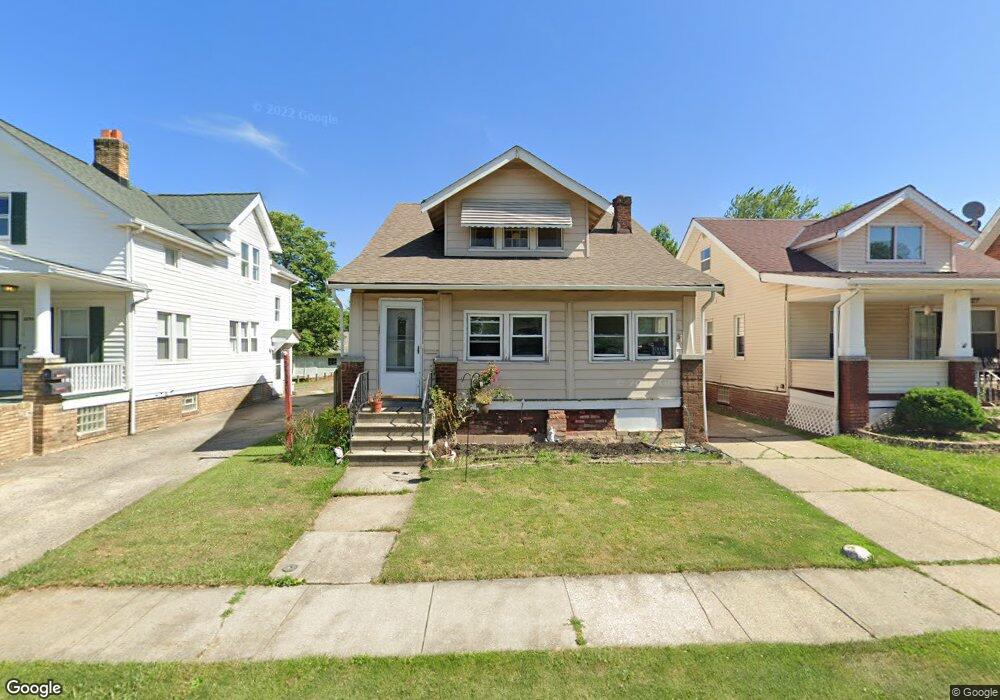
23001 Nicholas Ave Euclid, OH 44123
Estimated Value: $136,000 - $143,000
4
Beds
1
Bath
1,512
Sq Ft
$92/Sq Ft
Est. Value
About This Home
This home is located at 23001 Nicholas Ave, Euclid, OH 44123 and is currently estimated at $139,618, approximately $92 per square foot. 23001 Nicholas Ave is a home located in Cuyahoga County with nearby schools including Arbor Elementary School, Euclid Middle School, and Euclid High School.
Ownership History
Date
Name
Owned For
Owner Type
Purchase Details
Closed on
Nov 13, 2021
Sold by
Springborn Kent W and Springborn Lise
Bought by
Urban Sandra L and Urban Christopher
Current Estimated Value
Purchase Details
Closed on
Nov 9, 2021
Sold by
Williams Jan C and Williams David
Bought by
Urban Sandra L and Urban Christopher
Purchase Details
Closed on
Nov 3, 2021
Sold by
Estate Of Nancy Joan Springborn
Bought by
Springborn Ronald and Springborn Kent V
Purchase Details
Closed on
Oct 13, 1987
Sold by
Springborn Nelson A
Bought by
Urban Christopher & Sandra L
Purchase Details
Closed on
Jan 31, 1979
Sold by
Springborn Nelson and Springborn M
Bought by
Springborn Nelson A
Purchase Details
Closed on
Jan 1, 1975
Bought by
Springborn Nelson and Springborn M
Create a Home Valuation Report for This Property
The Home Valuation Report is an in-depth analysis detailing your home's value as well as a comparison with similar homes in the area
Home Values in the Area
Average Home Value in this Area
Purchase History
| Date | Buyer | Sale Price | Title Company |
|---|---|---|---|
| Urban Sandra L | -- | None Available | |
| Urban Sandra L | -- | None Available | |
| Urban Sandra L | -- | None Available | |
| Urban Sandra L | -- | None Available | |
| Urban Sandra L | -- | None Available | |
| Springborn Ronald | -- | None Available | |
| Urban Christopher & Sandra L | $42,000 | -- | |
| Springborn Nelson A | $18,000 | -- | |
| Springborn Nelson | -- | -- |
Source: Public Records
Tax History Compared to Growth
Tax History
| Year | Tax Paid | Tax Assessment Tax Assessment Total Assessment is a certain percentage of the fair market value that is determined by local assessors to be the total taxable value of land and additions on the property. | Land | Improvement |
|---|---|---|---|---|
| 2024 | $2,994 | $43,435 | $7,875 | $35,560 |
| 2023 | $2,372 | $27,130 | $6,200 | $20,930 |
| 2022 | $2,319 | $27,130 | $6,200 | $20,930 |
| 2021 | $2,576 | $27,130 | $6,200 | $20,930 |
| 2020 | $2,167 | $20,550 | $4,690 | $15,860 |
| 2019 | $1,945 | $58,700 | $13,400 | $45,300 |
| 2018 | $1,903 | $20,550 | $4,690 | $15,860 |
| 2017 | $1,997 | $17,440 | $3,120 | $14,320 |
| 2016 | $2,001 | $17,440 | $3,120 | $14,320 |
| 2015 | $1,825 | $17,440 | $3,120 | $14,320 |
| 2014 | $1,825 | $17,440 | $3,120 | $14,320 |
Source: Public Records
Map
Nearby Homes
- 23050 Tracy Ave
- 934 E 223rd St
- 21670 Wilmore Ave
- 21700 Westport Ave
- 21451 Arbor Ave
- 21570 Ball Ave
- 841 E 216th St
- 21481 Ball Ave
- 21170 Wilmore Ave
- 515 E 222nd St
- 22301 Milton Dr
- 21051 Nicholas Ave
- 860 E 245th St
- 23901 Colbourne Rd
- 21181 Ball Ave
- 21241 Miller Ave
- 21051 Westport Ave
- 21370 S Lake Shore Blvd
- 21050 Fuller Ave
- 20830 Tracy Ave
- 23011 Nicholas Ave
- 22951 Nicholas Ave
- 23103 Nicholas Ave
- 22920 Tracy Ave
- 22950 Tracy Ave
- 22871 Nicholas Ave
- 22900 Tracy Ave
- 22970 Tracy Ave
- 22870 Tracy Ave
- 23107 Nicholas Ave
- 22851 Nicholas Ave
- 23000 Tracy Ave
- 23010 Nicholas Ave
- 22980 Nicholas Ave
- 23100 Nicholas Ave
- 22850 Tracy Ave
- 22831 Nicholas Ave
- 23151 Nicholas Ave
- 22890 Nicholas Ave
- 23020 Tracy Ave