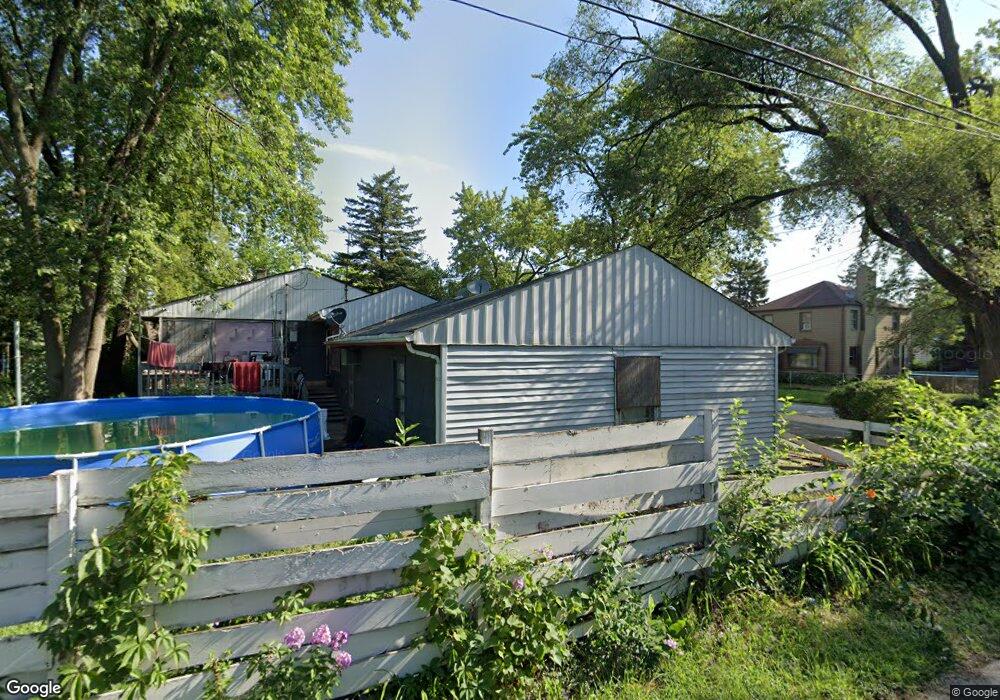
2301 167th St Hazel Crest, IL 60429
Hazel Crest Proper NeighborhoodEstimated Value: $146,481 - $195,000
4
Beds
2
Baths
1,362
Sq Ft
$132/Sq Ft
Est. Value
About This Home
This home is located at 2301 167th St, Hazel Crest, IL 60429 and is currently estimated at $179,870, approximately $132 per square foot. 2301 167th St is a home located in Cook County with nearby schools including Thornwood High School.
Ownership History
Date
Name
Owned For
Owner Type
Purchase Details
Closed on
Jul 29, 2009
Sold by
G8 Capital Fund X Llc
Bought by
Lloyd Gary C
Current Estimated Value
Purchase Details
Closed on
Jun 16, 2009
Sold by
Deutsche Bank National Trust Company
Bought by
G8 Capital Fund X Llc
Purchase Details
Closed on
May 30, 2008
Sold by
Cotton
Bought by
Deutsche Bank National Trust Co and Ameriquest Mortgage Securities Inc Asset
Purchase Details
Closed on
Apr 11, 2003
Sold by
Mosgers Thomas W
Bought by
Cotton James P
Purchase Details
Closed on
Jul 10, 2000
Sold by
Mosgers Melinda Sue
Bought by
Mosgers Melinda S
Home Financials for this Owner
Home Financials are based on the most recent Mortgage that was taken out on this home.
Original Mortgage
$57,200
Interest Rate
8.19%
Create a Home Valuation Report for This Property
The Home Valuation Report is an in-depth analysis detailing your home's value as well as a comparison with similar homes in the area
Home Values in the Area
Average Home Value in this Area
Purchase History
| Date | Buyer | Sale Price | Title Company |
|---|---|---|---|
| Lloyd Gary C | $23,000 | Able Title | |
| G8 Capital Fund X Llc | $10,000 | Able Title | |
| Deutsche Bank National Trust Co | -- | None Available | |
| Cotton James P | $84,000 | Stewart Title | |
| Cotton James P | $84,000 | Stewart Title | |
| Mosgers Melinda S | -- | -- |
Source: Public Records
Mortgage History
| Date | Status | Borrower | Loan Amount |
|---|---|---|---|
| Previous Owner | Mosgers Melinda S | $57,200 |
Source: Public Records
Tax History Compared to Growth
Tax History
| Year | Tax Paid | Tax Assessment Tax Assessment Total Assessment is a certain percentage of the fair market value that is determined by local assessors to be the total taxable value of land and additions on the property. | Land | Improvement |
|---|---|---|---|---|
| 2024 | $2,180 | $5,064 | $1,314 | $3,750 |
| 2023 | $1,504 | $5,064 | $1,314 | $3,750 |
| 2022 | $1,504 | $3,450 | $1,126 | $2,324 |
| 2021 | $1,499 | $3,447 | $1,125 | $2,322 |
| 2020 | $1,496 | $3,447 | $1,125 | $2,322 |
| 2019 | $1,932 | $4,185 | $1,032 | $3,153 |
| 2018 | $1,878 | $4,185 | $1,032 | $3,153 |
| 2017 | $1,839 | $4,185 | $1,032 | $3,153 |
| 2016 | $2,020 | $4,237 | $938 | $3,299 |
| 2015 | $1,918 | $4,237 | $938 | $3,299 |
| 2014 | $1,912 | $4,237 | $938 | $3,299 |
| 2013 | $1,921 | $4,568 | $938 | $3,630 |
Source: Public Records
Map
Nearby Homes
- 16732 Orchard Ridge Ave
- 16742 Crane Ave
- 16784 Anthony Ave
- 16751 Western Ave
- 16784 Crane Ave
- 16726 Head Ave
- 16780 Head Ave
- 16727 Head Ave
- 16846 Orchard Ridge Ave
- 16744 Trapet Ave
- 16876 Head Ave
- 16768 Bulger Ave
- 16913 Western Ave
- 16879 Head Ave
- 16919 Western Ave
- 16927 Crane Ave
- 16840 Bulger Ave
- 16969 Orchard Ridge Ave
- 16918 Shea Ave
- 2131 170th St
- 2301 167th St
- 2301 167th St
- 2301 167th St
- 2313 167th St
- 16724 Anthony Ave
- 2317 167th St
- 2317 W 167th St
- 16730 Anthony Ave
- 16725 Orchard Ridge Ave
- 16732 Anthony Ave
- 16737 Orchard Ridge Ave
- 2237 167th St
- 2237 167th St
- 16738 Anthony Ave
- 16725 Anthony Ave
- 16743 Orchard Ridge Ave
- 2233 167th St
- 2233 167th St
- 16729 Anthony Ave
- 16744 Anthony Ave