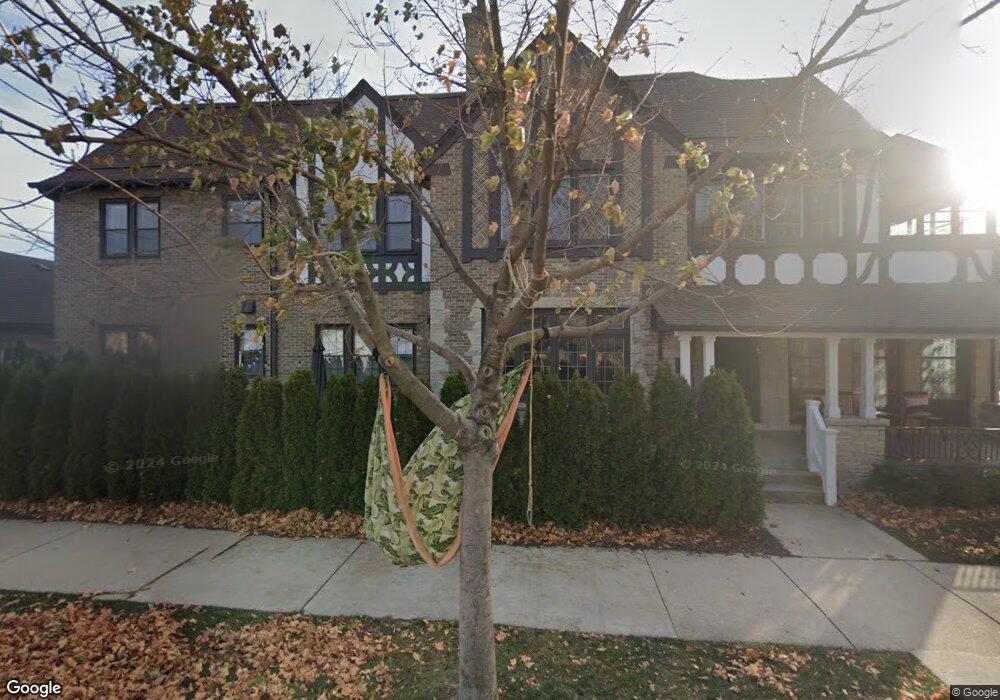
2301 E Marion St Milwaukee, WI 53211
Estimated Value: $776,000 - $960,455
8
Beds
6
Baths
5,012
Sq Ft
$168/Sq Ft
Est. Value
About This Home
This home is located at 2301 E Marion St, Milwaukee, WI 53211 and is currently estimated at $839,818, approximately $167 per square foot. 2301 E Marion St is a home located in Milwaukee County with nearby schools including Lake Bluff Elementary School, Shorewood Intermediate School, and Shorewood High School.
Ownership History
Date
Name
Owned For
Owner Type
Purchase Details
Closed on
Sep 25, 2015
Sold by
Paavola Frank M and Paavola Linda H
Bought by
Mcgrath Timothy D and Mcgrath Meghan M
Current Estimated Value
Home Financials for this Owner
Home Financials are based on the most recent Mortgage that was taken out on this home.
Original Mortgage
$472,500
Outstanding Balance
$363,618
Interest Rate
3.25%
Mortgage Type
Adjustable Rate Mortgage/ARM
Estimated Equity
$476,200
Purchase Details
Closed on
Oct 31, 2012
Sold by
Inda Lorre A and Borkovee Terre M
Bought by
Paavola Frank M and Paavola Linda H
Home Financials for this Owner
Home Financials are based on the most recent Mortgage that was taken out on this home.
Original Mortgage
$300,000
Interest Rate
3.4%
Mortgage Type
New Conventional
Purchase Details
Closed on
Oct 1, 1996
Sold by
Gad Richard C
Bought by
Gad Richard C and Richard C Gad Revocable Trust
Create a Home Valuation Report for This Property
The Home Valuation Report is an in-depth analysis detailing your home's value as well as a comparison with similar homes in the area
Home Values in the Area
Average Home Value in this Area
Purchase History
| Date | Buyer | Sale Price | Title Company |
|---|---|---|---|
| Mcgrath Timothy D | $544,000 | Attorney | |
| Paavola Frank M | $400,000 | None Available | |
| Gad Richard C | -- | -- |
Source: Public Records
Mortgage History
| Date | Status | Borrower | Loan Amount |
|---|---|---|---|
| Open | Mcgrath Timothy D | $472,500 | |
| Previous Owner | Paavola Frank M | $300,000 |
Source: Public Records
Tax History
| Year | Tax Paid | Tax Assessment Tax Assessment Total Assessment is a certain percentage of the fair market value that is determined by local assessors to be the total taxable value of land and additions on the property. | Land | Improvement |
|---|---|---|---|---|
| 2024 | $8,081 | $736,300 | $105,000 | $631,300 |
| 2023 | -- | $718,700 | $87,400 | $631,300 |
| 2022 | -- | $630,300 | $87,400 | $542,900 |
| 2021 | $15,640 | $630,300 | $542,900 | $87,400 |
| 2020 | $15,673 | $574,700 | $87,400 | $487,300 |
| 2019 | $14,806 | $549,700 | $87,400 | $462,300 |
| 2018 | $0 | $514,700 | $87,400 | $427,300 |
| 2017 | $14,411 | $514,700 | $87,400 | $427,300 |
| 2016 | $14,411 | $514,700 | $87,400 | $427,300 |
| 2015 | $13,732 | $498,500 | $87,400 | $411,100 |
| 2014 | $14,761 | $555,300 | $87,400 | $467,900 |
| 2013 | $14,150 | $555,300 | $87,400 | $467,900 |
Source: Public Records
Map
Nearby Homes
- 4449 N Maryland Ave
- 4134 N Murray Ave
- 1907 E Wood Place Unit 1909
- 4036 N Stowell Ave
- 3964 N Stowell Ave
- 4418 N Bartlett Ave Unit 20
- 4476 N Bartlett Ave
- 3915 N Downer Ave Unit 17
- 4018 N Newhall St
- 1554 E Glendale Ave Unit 56
- 2005 E Beverly Rd
- 1913 E Beverly Rd
- 2400 E Newton Ave
- 4101 N Morris Blvd
- 4639 N Larkin St
- 1910 E Newton Ave
- 4518 N Woodburn St Unit 2
- 3710 N Oakland Ave Unit 101
- 4400 N Wildwood Ave
- 3553 N Maryland Ave
- 4220 N Farwell Ave Unit 22
- 4216-4218 N Farwell Ave
- 2300/2302 E Marion St
- 4212 N Farwell Ave Unit 14
- 4212 N Farwell Ave Unit 4214
- 4221 N Prospect Ave
- 4210 N Farwell Ave
- 4308 N Farwell Ave
- 4301 N Prospect Ave
- 4215/4215A N Prospect Ave
- 2217 E Marion St
- 2219 E Marion St Unit A
- 4204 N Farwell Ave
- 4209/4211 N Prospect Ave
- 4217 N Farwell Ave
- 4309 N Prospect Ave
- 4301 N Farwell Ave
- 4312 N Farwell Ave
- 4213 N Farwell Ave
- 4305 N Farwell Ave
Your Personal Tour Guide
Ask me questions while you tour the home.