Estimated Value: $295,000 - $395,000
--
Bed
1
Bath
1,375
Sq Ft
$262/Sq Ft
Est. Value
About This Home
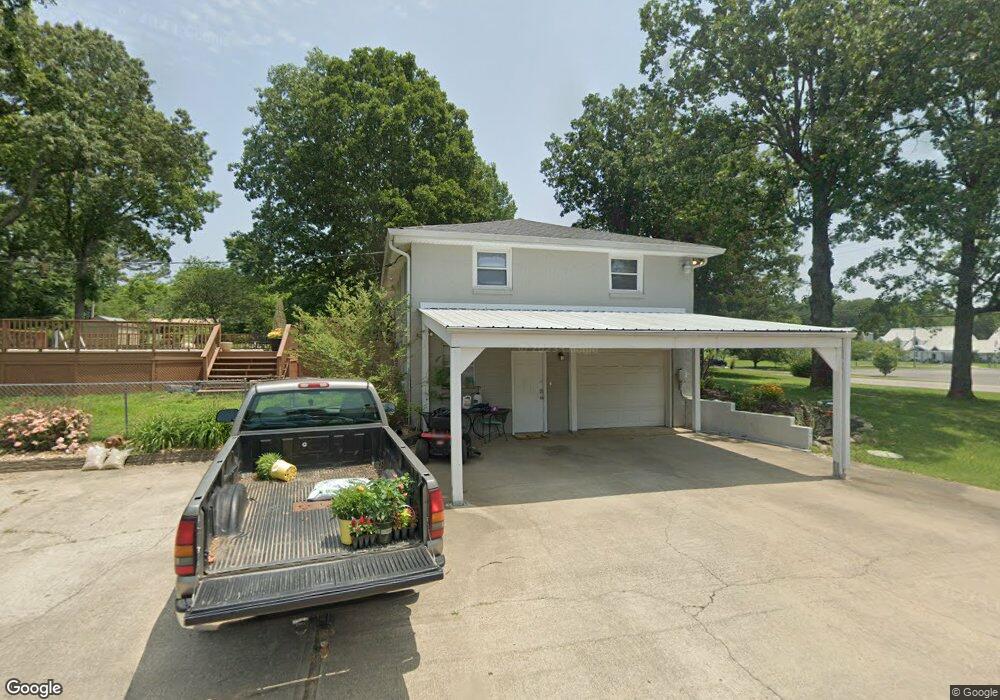
This home is located at 2301 Highway 96, Burns, TN 37029 and is currently estimated at $359,649, approximately $261 per square foot. 2301 Highway 96 is a home located in Dickson County with nearby schools including Stuart Burns Elementary School, Burns Middle School, and Dickson County High School.
Ownership History
Date
Name
Owned For
Owner Type
Purchase Details
Closed on
Oct 27, 2017
Sold by
Wall James R
Bought by
Svarda Alicia B
Current Estimated Value
Home Financials for this Owner
Home Financials are based on the most recent Mortgage that was taken out on this home.
Original Mortgage
$196,278
Outstanding Balance
$164,035
Interest Rate
3.75%
Mortgage Type
FHA
Estimated Equity
$195,614
Purchase Details
Closed on
Dec 6, 2006
Sold by
Frey Greg
Bought by
Wall James R
Home Financials for this Owner
Home Financials are based on the most recent Mortgage that was taken out on this home.
Original Mortgage
$130,000
Interest Rate
6.31%
Purchase Details
Closed on
Jun 21, 1991
Bought by
Waqng Tzeng G and Ikue Iwamuro
Purchase Details
Closed on
Jul 13, 1990
Bought by
Porter Joan Muraski
Purchase Details
Closed on
Feb 10, 1966
Bought by
Porter Don
Create a Home Valuation Report for This Property
The Home Valuation Report is an in-depth analysis detailing your home's value as well as a comparison with similar homes in the area
Home Values in the Area
Average Home Value in this Area
Purchase History
| Date | Buyer | Sale Price | Title Company |
|---|---|---|---|
| Svarda Alicia B | $199,900 | -- | |
| Wall James R | $130,000 | -- | |
| Waqng Tzeng G | $60,000 | -- | |
| Porter Joan Muraski | -- | -- | |
| Porter Don | -- | -- |
Source: Public Records
Mortgage History
| Date | Status | Borrower | Loan Amount |
|---|---|---|---|
| Open | Svarda Alicia B | $196,278 | |
| Previous Owner | Porter Don | $130,000 |
Source: Public Records
Tax History Compared to Growth
Tax History
| Year | Tax Paid | Tax Assessment Tax Assessment Total Assessment is a certain percentage of the fair market value that is determined by local assessors to be the total taxable value of land and additions on the property. | Land | Improvement |
|---|---|---|---|---|
| 2024 | $1,168 | $61,525 | $11,250 | $50,275 |
| 2023 | $1,168 | $42,450 | $5,875 | $36,575 |
| 2022 | $1,168 | $42,450 | $5,875 | $36,575 |
| 2021 | $1,168 | $42,450 | $5,875 | $36,575 |
| 2020 | $1,168 | $42,450 | $5,875 | $36,575 |
| 2019 | $1,168 | $42,450 | $5,875 | $36,575 |
| 2018 | $861 | $26,350 | $3,625 | $22,725 |
| 2017 | $861 | $26,350 | $3,625 | $22,725 |
| 2016 | $861 | $26,350 | $3,625 | $22,725 |
| 2015 | $800 | $22,675 | $3,625 | $19,050 |
| 2014 | $800 | $22,675 | $3,625 | $19,050 |
Source: Public Records
Map
Nearby Homes
- 1123 Johnson St
- 1119 Johnson St
- 1002 Village Ct
- 3215 Church St
- 3328 Church St
- 986 Hall Cemetery Rd
- 594 Main St
- 106 Meadowood Loop
- 454 Gum Branch Rd
- 1144 Chestnut Dr
- 106 Aaron Dr
- 164 Lena Loop
- 308 Beechwood Dr
- 101 Brookstone Dr
- 1017 Preston Dr
- 2305 Highway 47 E
- 208 Wyburn Place
- 614 Whirlaway Dr
- 503 Whirlaway Ct
- 634 Whirlaway Dr
- 2301 Tennessee 96
- 2215 Highway 96
- 2305 Highway 96
- 110 Reeder St
- 202 Tidwell St
- 2307 Highway 96
- 2211 Highway 96
- 2211 Tennessee 96
- 2209B Highway 96
- 2209 Tennessee 96
- 2209 Highway 96
- 2209 Highway 96 Unit A
- 2209 Tennessee 96
- 2209 Tennessee 96
- 108 Tidwell St
- 108 Tidwell St
- 201 Tidwell St
- 2309 Highway 96
- 210 Tidwell St
- 203 Tidwell St