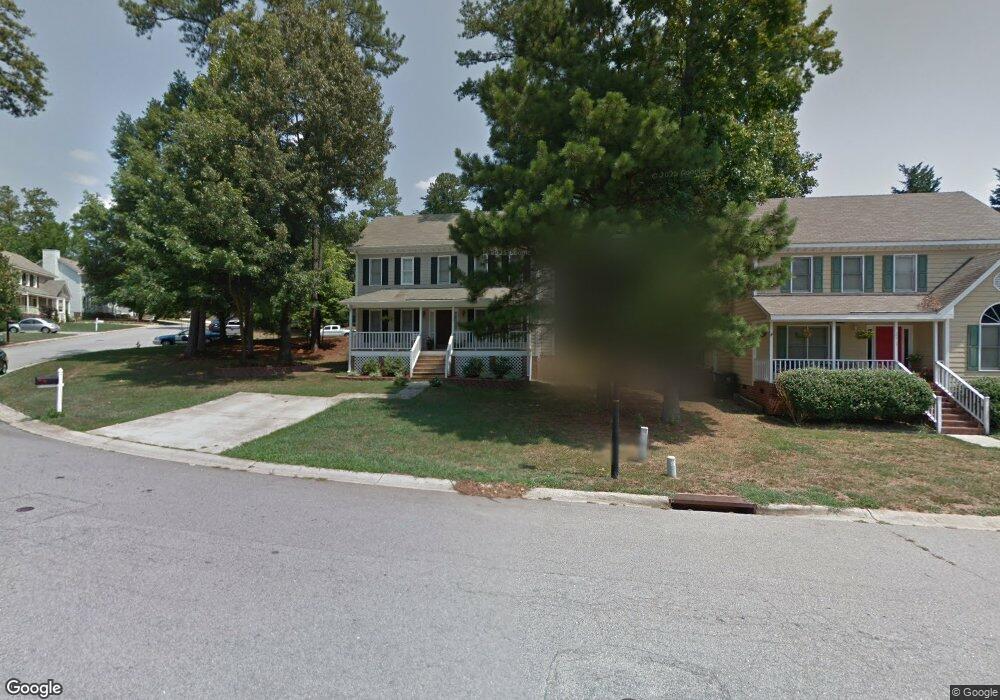
2301 Long And Winding Rd Raleigh, NC 27603
South Raleigh NeighborhoodEstimated Value: $383,000 - $399,000
3
Beds
3
Baths
1,728
Sq Ft
$228/Sq Ft
Est. Value
About This Home
This home is located at 2301 Long And Winding Rd, Raleigh, NC 27603 and is currently estimated at $393,455, approximately $227 per square foot. 2301 Long And Winding Rd is a home located in Wake County with nearby schools including Dillard Drive Magnet Elementary School, Dillard Drive Magnet Middle School, and Adventist Christian Academy of Raleigh.
Ownership History
Date
Name
Owned For
Owner Type
Purchase Details
Closed on
Jul 25, 2016
Sold by
Wolford Wallace L and Wolford Robin
Bought by
Bazemore Tiffany Silsbee and Bazemore Jan Marie
Current Estimated Value
Purchase Details
Closed on
Jun 10, 2005
Sold by
Daughtry Raeford and Daughtry Willa P
Bought by
Wolford Wallace L
Home Financials for this Owner
Home Financials are based on the most recent Mortgage that was taken out on this home.
Original Mortgage
$147,831
Interest Rate
5.69%
Mortgage Type
FHA
Purchase Details
Closed on
Aug 18, 1999
Sold by
Rosen Stanley P
Bought by
Daugherty Raeford and Daughtry Willa P
Home Financials for this Owner
Home Financials are based on the most recent Mortgage that was taken out on this home.
Original Mortgage
$114,000
Interest Rate
7.65%
Create a Home Valuation Report for This Property
The Home Valuation Report is an in-depth analysis detailing your home's value as well as a comparison with similar homes in the area
Home Values in the Area
Average Home Value in this Area
Purchase History
| Date | Buyer | Sale Price | Title Company |
|---|---|---|---|
| Bazemore Tiffany Silsbee | $201,000 | None Available | |
| Wolford Wallace L | $149,000 | -- | |
| Daugherty Raeford | $131,000 | -- |
Source: Public Records
Mortgage History
| Date | Status | Borrower | Loan Amount |
|---|---|---|---|
| Previous Owner | Wolford Wallace L | $147,831 | |
| Previous Owner | Daugherty Raeford | $114,000 |
Source: Public Records
Tax History Compared to Growth
Tax History
| Year | Tax Paid | Tax Assessment Tax Assessment Total Assessment is a certain percentage of the fair market value that is determined by local assessors to be the total taxable value of land and additions on the property. | Land | Improvement |
|---|---|---|---|---|
| 2025 | $3,249 | $370,205 | $140,000 | $230,205 |
| 2024 | $3,235 | $370,205 | $140,000 | $230,205 |
| 2023 | $2,503 | $227,801 | $60,000 | $167,801 |
| 2022 | $2,326 | $227,801 | $60,000 | $167,801 |
| 2021 | $2,237 | $227,801 | $60,000 | $167,801 |
| 2020 | $2,196 | $227,801 | $60,000 | $167,801 |
| 2019 | $2,059 | $175,928 | $52,000 | $123,928 |
| 2018 | $1,942 | $175,928 | $52,000 | $123,928 |
| 2017 | $1,850 | $175,928 | $52,000 | $123,928 |
| 2016 | $1,812 | $175,928 | $52,000 | $123,928 |
| 2015 | $1,690 | $161,294 | $44,000 | $117,294 |
| 2014 | $1,604 | $161,294 | $44,000 | $117,294 |
Source: Public Records
Map
Nearby Homes
- 3020 Centennial Woods Dr Unit 101
- 2021 Wolftech Ln Unit 102
- 1911 Wolftech Ln Unit 302
- 2011 Wolfmill Dr Unit 301
- 2120 Wolftech Ln Unit 304
- 1929 Fieldhouse Ave
- 3770 Pardue Woods Place Unit 201
- 2108 Leadenhall Way
- 3223 Tryon Rd
- 1901 Trailwood Heights Ln Unit 304
- 2528 Beech Gap Ct
- 2221 Mountain Mist Ct Unit 201
- 2201 Mountain Mist Ct Unit 103
- 2920 Barrymore St Unit 106
- 2228 Trailwood Valley Cir
- 2831 Barrymore St Unit 107
- 2271 Trailwood Valley Cir
- 2621 Ivory Run Way Unit 105
- 0 Crump Rd
- 2901 Alder Ridge Ln
- 2313 Long And Winding Rd
- 3101 Norwegian Woods Ct
- 2308 Long And Winding Rd
- 2304 Long And Winding Rd
- 2300 Long And Winding Rd
- 2317 Long And Winding Rd
- 2220 Pauls Penny Ln
- 2312 Long And Winding Rd
- 3108 Norwegian Woods Ct
- 2240 Long And Winding Rd
- 3100 Norwegian Woods Ct
- 3104 Norwegian Woods Ct
- 2216 Pauls Penny Ln
- 2404 Eleanor Rigby Ct
- 2316 Long And Winding Rd
- 2236 Long And Winding Rd
- 2212 Pauls Penny Ln
- 2225 Long And Winding Rd
- 2217 Long And Winding Rd
- 2405 Eleanor Rigby Ct