Estimated Value: $278,000 - $386,000
6
Beds
4
Baths
2,560
Sq Ft
$137/Sq Ft
Est. Value
About This Home
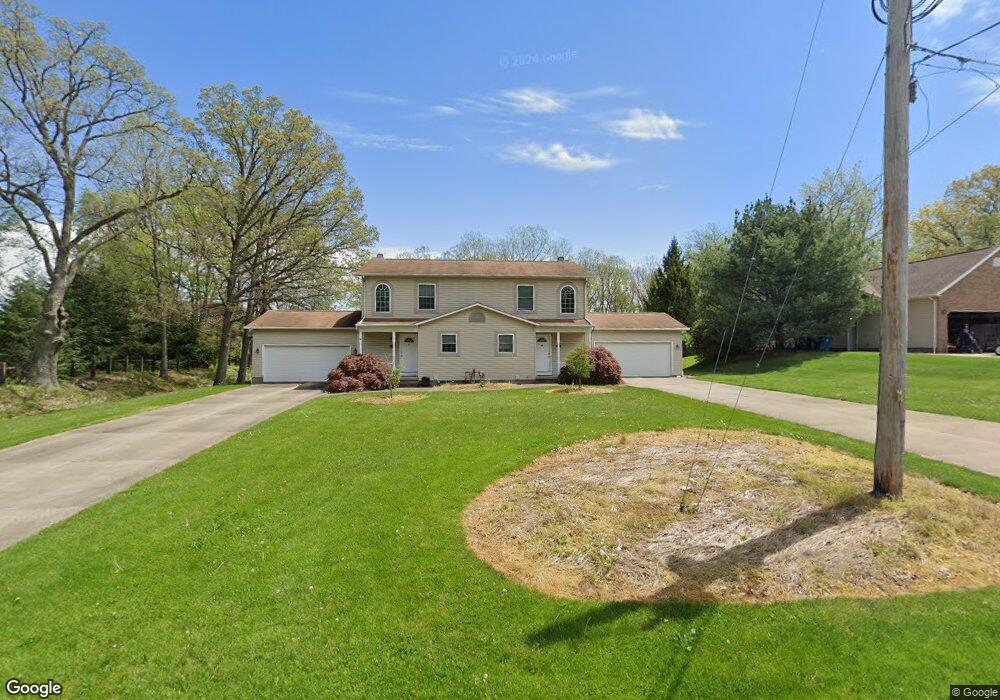
This home is located at 2301 Mallard Dr Unit 2303, Akron, OH 44319 and is currently estimated at $350,038, approximately $136 per square foot. 2301 Mallard Dr Unit 2303 is a home located in Summit County with nearby schools including Springfield High School, Eagle Elementary, and Chapel Hill Christian School-Green Campus.
Ownership History
Date
Name
Owned For
Owner Type
Purchase Details
Closed on
Sep 4, 2015
Sold by
Kilbane Michael P
Bought by
Kilbane Michael P
Current Estimated Value
Purchase Details
Closed on
Apr 17, 2006
Sold by
Kilbane Merry and Fortner Merry J
Bought by
Kilbane Michael P and Kilbane Mike
Home Financials for this Owner
Home Financials are based on the most recent Mortgage that was taken out on this home.
Original Mortgage
$196,000
Outstanding Balance
$113,413
Interest Rate
6.48%
Mortgage Type
Fannie Mae Freddie Mac
Estimated Equity
$236,625
Purchase Details
Closed on
Nov 2, 1998
Sold by
Jacobs Donald W
Bought by
Kilbane Mike and Kilbane Merry
Purchase Details
Closed on
Jun 29, 1994
Sold by
Jacobs Bernard B
Bought by
Jacobs Donald W
Create a Home Valuation Report for This Property
The Home Valuation Report is an in-depth analysis detailing your home's value as well as a comparison with similar homes in the area
Home Values in the Area
Average Home Value in this Area
Purchase History
| Date | Buyer | Sale Price | Title Company |
|---|---|---|---|
| Kilbane Michael P | -- | Title365 | |
| Kilbane Michael P | -- | Progressive Land Title | |
| Kilbane Mike | $28,000 | Bond & Associates Title Agen | |
| Jacobs Donald W | $10,125 | -- |
Source: Public Records
Mortgage History
| Date | Status | Borrower | Loan Amount |
|---|---|---|---|
| Open | Kilbane Michael P | $196,000 |
Source: Public Records
Tax History Compared to Growth
Tax History
| Year | Tax Paid | Tax Assessment Tax Assessment Total Assessment is a certain percentage of the fair market value that is determined by local assessors to be the total taxable value of land and additions on the property. | Land | Improvement |
|---|---|---|---|---|
| 2025 | $5,255 | $92,810 | $16,401 | $76,409 |
| 2024 | $5,255 | $92,810 | $16,401 | $76,409 |
| 2023 | $5,255 | $92,810 | $16,401 | $76,409 |
| 2022 | $4,573 | $69,780 | $12,331 | $57,449 |
| 2021 | $4,472 | $69,780 | $12,331 | $57,449 |
| 2020 | $4,410 | $69,780 | $12,330 | $57,450 |
| 2019 | $5,406 | $79,570 | $10,220 | $69,350 |
| 2018 | $5,196 | $79,570 | $10,220 | $69,350 |
| 2017 | $5,406 | $79,570 | $10,220 | $69,350 |
| 2016 | $5,457 | $79,570 | $10,220 | $69,350 |
| 2015 | $5,406 | $79,570 | $10,220 | $69,350 |
| 2014 | $5,341 | $79,570 | $10,220 | $69,350 |
| 2013 | $5,414 | $80,320 | $10,220 | $70,100 |
Source: Public Records
Map
Nearby Homes
- 2218 Lee Dr
- 1043 Krumroy Rd
- 1872 Pickle Rd
- 1899 Edwards Dr
- 1254 Maxfli Dr
- 1674 Betz Dr
- 1658 Betz Dr
- 1649 Betz Dr
- 1333 Derbydale Rd
- 2057 Darnell Dr
- 2872 Ironwood Dr
- 1575 Faye Rd
- 3272 Doubler Dr
- 2025 S Plaza Dr
- 0 Killian Rd Unit 5145777
- 1686 Faye Rd
- 3273 S Jasmine Ave
- 580 Colchester Ct
- 0 Fortuna Dr Unit 5005346
- 0 Woodview Dr
- 2315 Mallard Dr
- 2316 Mallard Dr
- 2335 Mallard Dr
- 1092 Loamshire Rd
- 2336 Mallard Dr
- 1081 Archmere Dr
- 1091 Archmere Dr
- 1055 Archmere Dr
- 1069 Archmere Dr Unit 1071
- 1100 Archmere Dr
- 1067 Loamshire Rd
- 1090 Archmere Dr Unit 1092
- 2373 Mallard Dr
- 1080 Archmere Dr
- 1066 Archmere Dr
- 2377 Mallard Dr
- 1049 Archmere Dr
- 2386 Mallard Dr
- 1089 Buena Vista Dr
- 2381 Mallard Dr Unit 2395