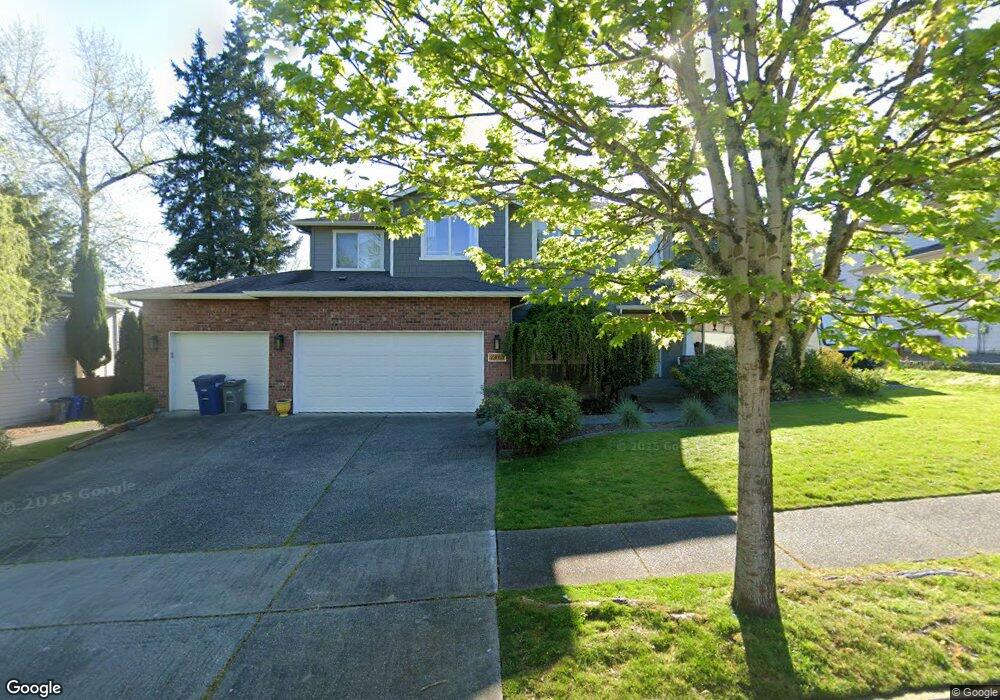
23013 21st Ave SE Bothell, WA 98021
Canyon Park NeighborhoodEstimated Value: $1,214,753 - $1,416,000
3
Beds
3
Baths
2,330
Sq Ft
$552/Sq Ft
Est. Value
About This Home
This home is located at 23013 21st Ave SE, Bothell, WA 98021 and is currently estimated at $1,286,688, approximately $552 per square foot. 23013 21st Ave SE is a home located in Snohomish County with nearby schools including Maywood Hills Elementary School, Canyon Park Junior High School, and Bothell High School.
Ownership History
Date
Name
Owned For
Owner Type
Purchase Details
Closed on
Oct 15, 2025
Sold by
Hoffman Kate
Bought by
Booth Amanda and Booth Menard Dolotina
Current Estimated Value
Home Financials for this Owner
Home Financials are based on the most recent Mortgage that was taken out on this home.
Original Mortgage
$881,250
Outstanding Balance
$881,250
Interest Rate
6.5%
Mortgage Type
New Conventional
Estimated Equity
$405,438
Purchase Details
Closed on
Aug 18, 2015
Sold by
Rankins Kate and Rankins Matthew
Bought by
Hoffman Kate
Purchase Details
Closed on
Dec 27, 2011
Sold by
Roberts Scott M and Roberts Andrea M
Bought by
Rankins Matthew O and Rankins Kate H
Home Financials for this Owner
Home Financials are based on the most recent Mortgage that was taken out on this home.
Original Mortgage
$403,492
Interest Rate
3.91%
Mortgage Type
VA
Purchase Details
Closed on
Feb 19, 2002
Sold by
Puget Homes Corp
Bought by
Roberts Scott M and Roberts Andrea M
Home Financials for this Owner
Home Financials are based on the most recent Mortgage that was taken out on this home.
Original Mortgage
$255,000
Interest Rate
6.8%
Create a Home Valuation Report for This Property
The Home Valuation Report is an in-depth analysis detailing your home's value as well as a comparison with similar homes in the area
Home Values in the Area
Average Home Value in this Area
Purchase History
| Date | Buyer | Sale Price | Title Company |
|---|---|---|---|
| Booth Amanda | $1,175,000 | Ticor Title | |
| Hoffman Kate | -- | None Available | |
| Rankins Matthew O | $395,280 | Wfg National Title Company | |
| Roberts Scott M | $319,950 | -- |
Source: Public Records
Mortgage History
| Date | Status | Borrower | Loan Amount |
|---|---|---|---|
| Open | Booth Amanda | $881,250 | |
| Previous Owner | Rankins Matthew O | $403,492 | |
| Previous Owner | Roberts Scott M | $255,000 |
Source: Public Records
Tax History Compared to Growth
Tax History
| Year | Tax Paid | Tax Assessment Tax Assessment Total Assessment is a certain percentage of the fair market value that is determined by local assessors to be the total taxable value of land and additions on the property. | Land | Improvement |
|---|---|---|---|---|
| 2025 | $7,945 | $1,049,400 | $707,800 | $341,600 |
| 2024 | $7,945 | $948,300 | $618,500 | $329,800 |
| 2023 | $8,003 | $1,043,400 | $679,500 | $363,900 |
| 2022 | $6,967 | $731,900 | $423,000 | $308,900 |
| 2020 | $7,091 | $693,000 | $382,500 | $310,500 |
| 2019 | $6,108 | $617,900 | $310,500 | $307,400 |
| 2018 | $5,587 | $544,300 | $270,000 | $274,300 |
| 2017 | $4,910 | $484,000 | $225,000 | $259,000 |
| 2016 | $4,385 | $446,100 | $198,000 | $248,100 |
| 2015 | $4,329 | $417,500 | $184,500 | $233,000 |
| 2013 | $3,944 | $334,600 | $148,500 | $186,100 |
Source: Public Records
Map
Nearby Homes
- 23214 27th Ave SE Unit 2
- 23210 27th Ave SE Unit 2
- 23210 27th Ave SE Unit 1
- 3520 237th St SE Unit 45
- 229 xx 15th Ave SE
- 23825 15th Ave SE Unit 93
- 23825 15th Ave SE Unit 183
- 23825 15th Ave SE Unit 159
- 1448 238th St SE
- 1442 238th St SE
- 24319 13 Ave SE Unit CR21
- 23614 15th Ave SE
- 24334 13 Ave SE Unit 14
- 24330 13 Ave SE Unit CR13
- 24318 13 Ave SE Unit 10
- 24322 13 Ave SE Unit 11
- 23004 Bothell Everett Hwy
- 3333 228th St SE Unit 69
- 3333 228th St SE Unit 74
- 3333 228th St SE Unit 100
- 23017 21st Ave SE
- 23005 21st Ave SE
- 23009 21st Ave SE
- 23009 21st Ave SE
- 23012 21st Ave SE
- 23021 21st Ave SE
- 23020 21st Ave SE
- 23021 21st Ave SE
- 23107 21st Ave SE
- 22929 21st Ave SE
- 23103 21st Ave SE
- 23108 21st Ave SE
- 22920 21st Ave SE
- 22920 21st Ave SE
- 22920 21st Ave SE
- 23109 20th Ave SE
- 23111 21st Ave SE
- 23117 20th Ave SE
- 23023 20th Ave SE
- 23116 21st Ave SE