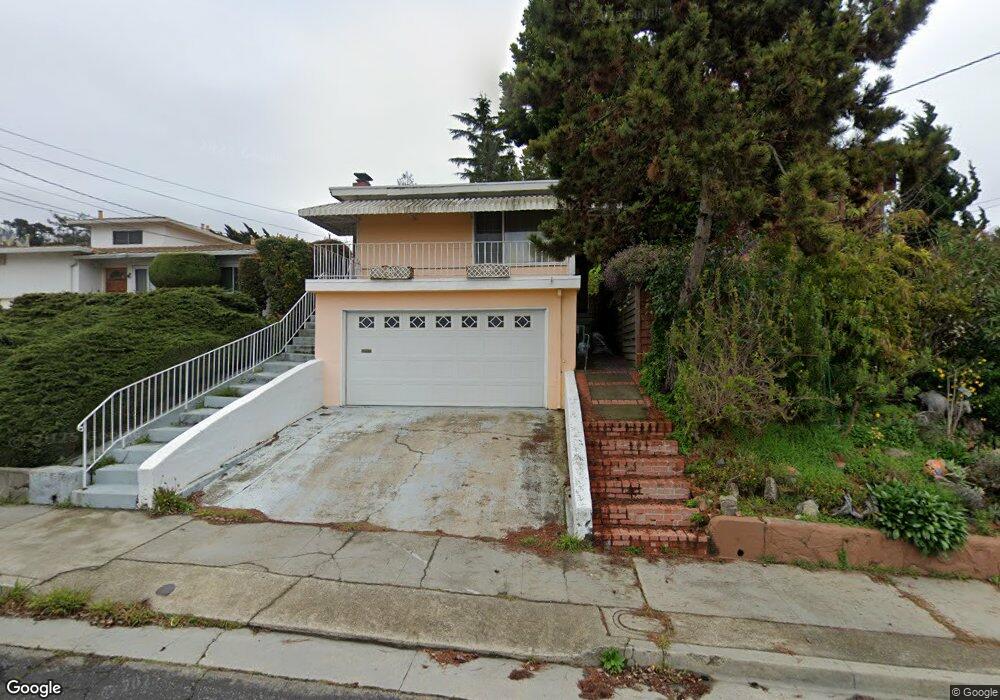
2302 Gloria St El Cerrito, CA 94530
Estimated Value: $655,000 - $989,000
2
Beds
2
Baths
1,006
Sq Ft
$856/Sq Ft
Est. Value
About This Home
This home is located at 2302 Gloria St, El Cerrito, CA 94530 and is currently estimated at $861,206, approximately $856 per square foot. 2302 Gloria St is a home located in Contra Costa County with nearby schools including Mira Vista Elementary School, Fred T. Korematsu Middle School, and El Cerrito Senior High School.
Ownership History
Date
Name
Owned For
Owner Type
Purchase Details
Closed on
Feb 12, 2024
Sold by
Burton Gamphon Aut
Bought by
Nguyen Phoung Mai
Current Estimated Value
Purchase Details
Closed on
Nov 3, 1997
Sold by
Yaghoub Saidian
Bought by
Burton Gamphon Aut and Nguyen Phuong Mai
Home Financials for this Owner
Home Financials are based on the most recent Mortgage that was taken out on this home.
Original Mortgage
$154,400
Interest Rate
7.26%
Mortgage Type
Purchase Money Mortgage
Purchase Details
Closed on
Oct 21, 1997
Sold by
Nancy Hemmen
Bought by
Saidian Yaghoub
Home Financials for this Owner
Home Financials are based on the most recent Mortgage that was taken out on this home.
Original Mortgage
$154,400
Interest Rate
7.26%
Mortgage Type
Purchase Money Mortgage
Create a Home Valuation Report for This Property
The Home Valuation Report is an in-depth analysis detailing your home's value as well as a comparison with similar homes in the area
Home Values in the Area
Average Home Value in this Area
Purchase History
| Date | Buyer | Sale Price | Title Company |
|---|---|---|---|
| Nguyen Phoung Mai | -- | None Listed On Document | |
| Burton Gamphon Aut | $193,000 | Nortwestern Title Company | |
| Saidian Yaghoub | -- | Northwestern Title |
Source: Public Records
Mortgage History
| Date | Status | Borrower | Loan Amount |
|---|---|---|---|
| Previous Owner | Burton Gamphon Aut | $154,400 |
Source: Public Records
Tax History Compared to Growth
Tax History
| Year | Tax Paid | Tax Assessment Tax Assessment Total Assessment is a certain percentage of the fair market value that is determined by local assessors to be the total taxable value of land and additions on the property. | Land | Improvement |
|---|---|---|---|---|
| 2025 | $4,901 | $308,145 | $128,922 | $179,223 |
| 2024 | $4,817 | $302,104 | $126,395 | $175,709 |
| 2023 | $4,817 | $296,181 | $123,917 | $172,264 |
| 2022 | $4,721 | $290,375 | $121,488 | $168,887 |
| 2021 | $4,675 | $284,682 | $119,106 | $165,576 |
| 2019 | $4,373 | $276,240 | $115,574 | $160,666 |
| 2018 | $4,218 | $270,824 | $113,308 | $157,516 |
| 2017 | $4,155 | $265,515 | $111,087 | $154,428 |
| 2016 | $4,133 | $260,309 | $108,909 | $151,400 |
| 2015 | $4,144 | $256,400 | $107,274 | $149,126 |
| 2014 | $4,108 | $251,378 | $105,173 | $146,205 |
Source: Public Records
Map
Nearby Homes