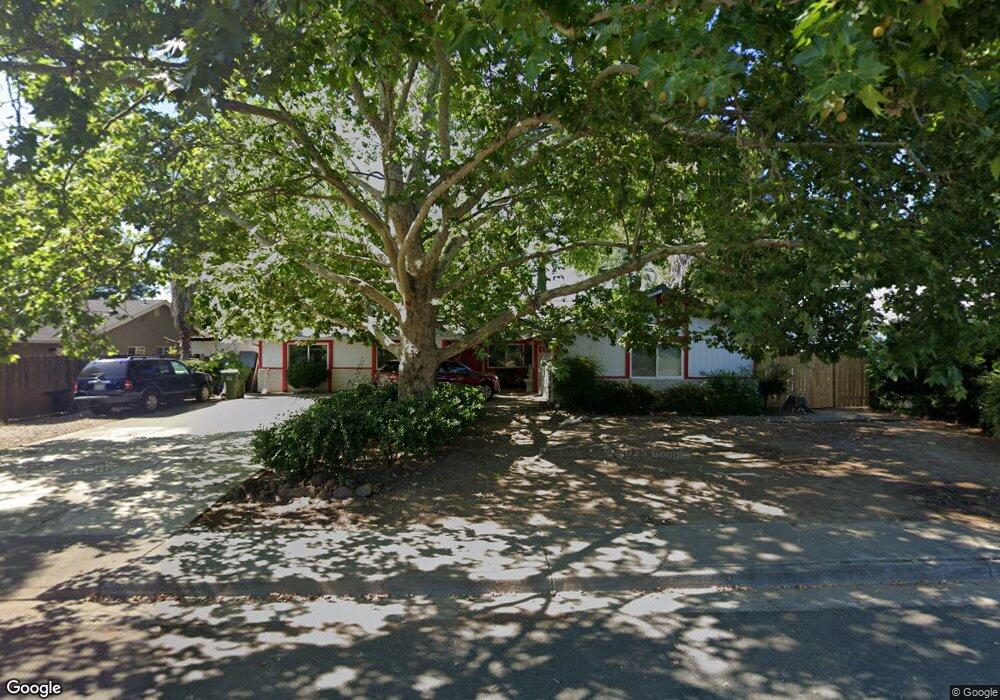
2303 Carnelian Way Redding, CA 96003
Lake Redding NeighborhoodEstimated Value: $405,181 - $465,000
3
Beds
2
Baths
1,921
Sq Ft
$225/Sq Ft
Est. Value
About This Home
This home is located at 2303 Carnelian Way, Redding, CA 96003 and is currently estimated at $432,295, approximately $225 per square foot. 2303 Carnelian Way is a home located in Shasta County with nearby schools including Turtle Bay, Sequoia Middle School, and Shasta High School.
Ownership History
Date
Name
Owned For
Owner Type
Purchase Details
Closed on
Nov 15, 2019
Sold by
Tona Margaret Antoinette
Bought by
Tona Frank Henry and Tona Antoinette M
Current Estimated Value
Purchase Details
Closed on
Sep 9, 2019
Sold by
Tona Frank
Bought by
Tona Frank Henry and Tona Antoinette M
Purchase Details
Closed on
Aug 22, 2002
Sold by
Tona M Antoinette
Bought by
Tona Frank
Home Financials for this Owner
Home Financials are based on the most recent Mortgage that was taken out on this home.
Original Mortgage
$112,000
Outstanding Balance
$46,986
Interest Rate
6.43%
Mortgage Type
Purchase Money Mortgage
Estimated Equity
$385,309
Purchase Details
Closed on
Aug 21, 2002
Sold by
Vieweg Deborah A
Bought by
Tona Frank
Home Financials for this Owner
Home Financials are based on the most recent Mortgage that was taken out on this home.
Original Mortgage
$112,000
Outstanding Balance
$46,986
Interest Rate
6.43%
Mortgage Type
Purchase Money Mortgage
Estimated Equity
$385,309
Create a Home Valuation Report for This Property
The Home Valuation Report is an in-depth analysis detailing your home's value as well as a comparison with similar homes in the area
Home Values in the Area
Average Home Value in this Area
Purchase History
| Date | Buyer | Sale Price | Title Company |
|---|---|---|---|
| Tona Frank Henry | -- | None Available | |
| Tona Frank Henry | -- | None Available | |
| Tona Frank | -- | Alliance Title Company | |
| Tona Frank | $186,000 | Alliance Title Company |
Source: Public Records
Mortgage History
| Date | Status | Borrower | Loan Amount |
|---|---|---|---|
| Open | Tona Frank | $112,000 |
Source: Public Records
Tax History
| Year | Tax Paid | Tax Assessment Tax Assessment Total Assessment is a certain percentage of the fair market value that is determined by local assessors to be the total taxable value of land and additions on the property. | Land | Improvement |
|---|---|---|---|---|
| 2025 | $2,722 | $269,366 | $72,401 | $196,965 |
| 2024 | $2,679 | $264,085 | $70,982 | $193,103 |
| 2023 | $2,679 | $258,908 | $69,591 | $189,317 |
| 2022 | $2,633 | $253,832 | $68,227 | $185,605 |
| 2021 | $2,618 | $248,856 | $66,890 | $181,966 |
| 2020 | $2,652 | $246,306 | $66,205 | $180,101 |
| 2019 | $2,517 | $241,477 | $64,907 | $176,570 |
| 2018 | $2,538 | $236,743 | $63,635 | $173,108 |
| 2017 | $2,523 | $232,102 | $62,388 | $169,714 |
| 2016 | $2,441 | $227,552 | $61,165 | $166,387 |
| 2015 | $2,409 | $224,135 | $60,247 | $163,888 |
| 2014 | $2,392 | $219,745 | $59,067 | $160,678 |
Source: Public Records
Map
Nearby Homes
- 2520 Snow Ln
- 310 Overhill Dr
- 1833 Del Mar Ave
- 370 River Park Dr
- 805 Christine Ave
- 531 Aurora Place
- 837 Coronado St
- 315 River Park Dr
- 1066 Pine St
- 686 Coronado St
- 3243 Stanford Dr
- 582 River Oaks Dr
- 802 Palatine Ct
- 2565 North St
- 1377 Willis St
- 500-550 Quartz Hill Rd
- 3360 Stanford Dr
- 866 Palatine Ct
- 1025 Chardonnay Walk
- 1715 Barbara Rd
- 2349 Carnelian Way
- 2289 Carnelian Way
- 2381 Carnelian Way Unit 1A
- 2247 Carnelian Way
- 310 Travertine Ct
- 2376 Carnelian Way
- 311 Travertine Ct
- 2413 Carnelian Way
- 2211 Carnelian Way
- 340 Travertine Ct
- 327 Agate Way
- 2441 Carnelian Way
- 360 Travertine Ct
- 300 Elk Dr
- 341 Travertine Ct
- 300 Agate Way
- 351 Agate Way
- 380 Travertine Ct
- 288 Onyx Ct
- 326 Agate Way
Your Personal Tour Guide
Ask me questions while you tour the home.