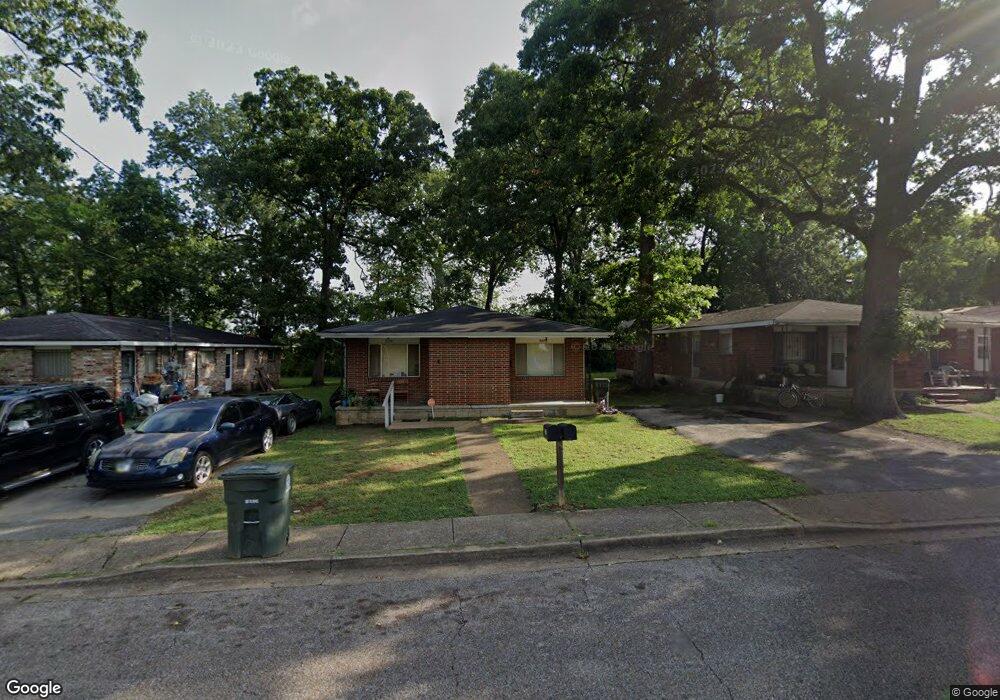
2303 E 5th St Chattanooga, TN 37404
Glenwood NeighborhoodEstimated Value: $231,888 - $271,000
Studio
2
Baths
1,494
Sq Ft
$171/Sq Ft
Est. Value
About This Home
This home is located at 2303 E 5th St, Chattanooga, TN 37404 and is currently estimated at $255,222, approximately $170 per square foot. 2303 E 5th St is a home located in Hamilton County with nearby schools including Orchard Knob Elementary School, Orchard Knob Middle School, and Brainerd High School.
Ownership History
Date
Name
Owned For
Owner Type
Purchase Details
Closed on
Mar 6, 2002
Sold by
Wheat Carolyn B
Bought by
Geary Ronnie H and Geary Betty
Current Estimated Value
Home Financials for this Owner
Home Financials are based on the most recent Mortgage that was taken out on this home.
Original Mortgage
$75,000
Outstanding Balance
$30,241
Interest Rate
7%
Mortgage Type
Seller Take Back
Estimated Equity
$224,981
Purchase Details
Closed on
Aug 24, 2001
Sold by
Wheat J Robert and Wheat Carolyn B
Bought by
Wheat Carolyn B and Revocable Tr Agreement Carolyn B Wheat
Create a Home Valuation Report for This Property
The Home Valuation Report is an in-depth analysis detailing your home's value as well as a comparison with similar homes in the area
Home Values in the Area
Average Home Value in this Area
Purchase History
| Date | Buyer | Sale Price | Title Company |
|---|---|---|---|
| Geary Ronnie H | $100,000 | -- | |
| Wheat Carolyn B | -- | -- |
Source: Public Records
Mortgage History
| Date | Status | Borrower | Loan Amount |
|---|---|---|---|
| Open | Geary Ronnie H | $75,000 |
Source: Public Records
Tax History
| Year | Tax Paid | Tax Assessment Tax Assessment Total Assessment is a certain percentage of the fair market value that is determined by local assessors to be the total taxable value of land and additions on the property. | Land | Improvement |
|---|---|---|---|---|
| 2025 | $1,310 | $86,400 | $0 | $0 |
| 2024 | $644 | $28,800 | $0 | $0 |
| 2023 | $644 | $28,800 | $0 | $0 |
| 2022 | $644 | $28,800 | $0 | $0 |
| 2021 | $644 | $28,800 | $0 | $0 |
| 2020 | $531 | $19,200 | $0 | $0 |
| 2019 | $531 | $19,200 | $0 | $0 |
| 2018 | $564 | $19,200 | $0 | $0 |
| 2017 | $531 | $19,200 | $0 | $0 |
| 2016 | $498 | $0 | $0 | $0 |
| 2015 | $1,029 | $18,000 | $0 | $0 |
| 2014 | $1,029 | $0 | $0 | $0 |
Source: Public Records
Map
Nearby Homes
- 360 Derby Cir
- 2415 Vine St
- 2000 E 5th St
- 2512 E 4th St
- 2510 Vine St
- 2502 Oak St
- 2000 Oak St
- 2202 Duncan Ave
- 2103 Blackford St
- 2001 Garfield St
- 508 Kilmer St
- 2004 McCallie Ave
- 1946 Blackford St
- 151 N Orchard Knob Ave
- 1908 McCallie Ave
- 2116 Sharp St
- 2607 McCallie Ave
- 2611 McCallie Ave
- 1908 Cleveland Ave
- 2115 Union Ave
Your Personal Tour Guide
Ask me questions while you tour the home.