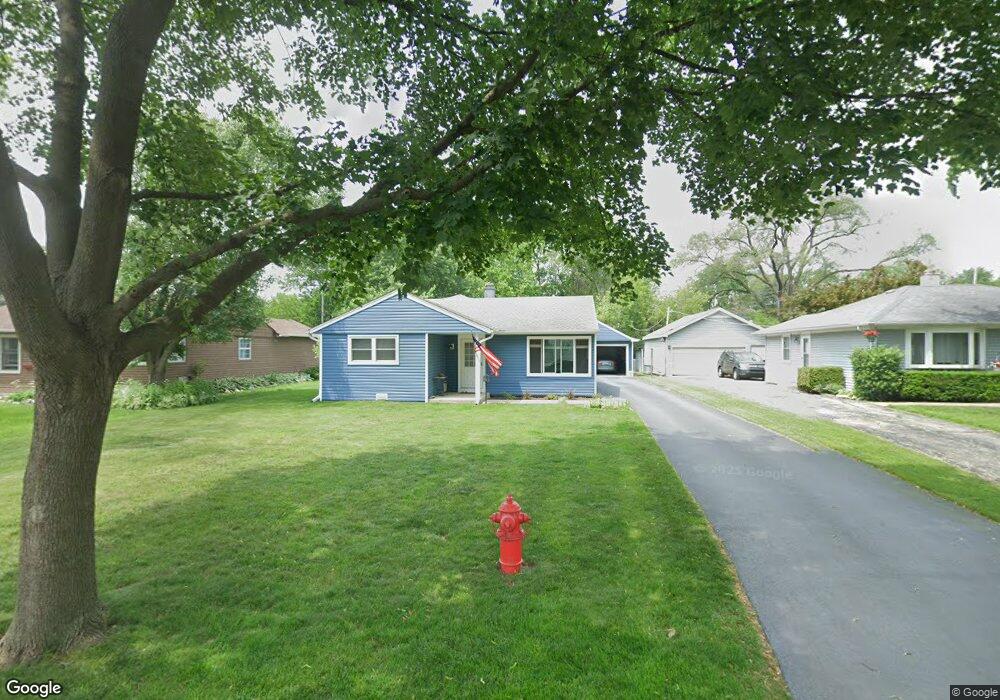
2303 Flicker Ln Rolling Meadows, IL 60008
Estimated Value: $354,000 - $395,000
3
Beds
1
Bath
1,530
Sq Ft
$243/Sq Ft
Est. Value
About This Home
This home is located at 2303 Flicker Ln, Rolling Meadows, IL 60008 and is currently estimated at $371,329, approximately $242 per square foot. 2303 Flicker Ln is a home located in Cook County with nearby schools including Kimball Hill Elementary School, Carl Sandburg Junior High School, and Rolling Meadows High School.
Ownership History
Date
Name
Owned For
Owner Type
Purchase Details
Closed on
Mar 27, 1998
Sold by
Palluck Richard Charles
Bought by
Blaker Thomas D and Blaker Linda L
Current Estimated Value
Home Financials for this Owner
Home Financials are based on the most recent Mortgage that was taken out on this home.
Original Mortgage
$167,250
Outstanding Balance
$28,395
Interest Rate
7.27%
Mortgage Type
VA
Estimated Equity
$342,934
Create a Home Valuation Report for This Property
The Home Valuation Report is an in-depth analysis detailing your home's value as well as a comparison with similar homes in the area
Home Values in the Area
Average Home Value in this Area
Purchase History
| Date | Buyer | Sale Price | Title Company |
|---|---|---|---|
| Blaker Thomas D | $164,000 | -- |
Source: Public Records
Mortgage History
| Date | Status | Borrower | Loan Amount |
|---|---|---|---|
| Open | Blaker Thomas D | $167,250 |
Source: Public Records
Tax History
| Year | Tax Paid | Tax Assessment Tax Assessment Total Assessment is a certain percentage of the fair market value that is determined by local assessors to be the total taxable value of land and additions on the property. | Land | Improvement |
|---|---|---|---|---|
| 2025 | $7,259 | $32,000 | $6,513 | $25,487 |
| 2024 | $7,259 | $27,000 | $5,511 | $21,489 |
| 2023 | $6,921 | $27,000 | $5,511 | $21,489 |
| 2022 | $6,921 | $27,000 | $5,511 | $21,489 |
| 2021 | $5,746 | $20,681 | $3,256 | $17,425 |
| 2020 | $5,684 | $20,681 | $3,256 | $17,425 |
| 2019 | $5,725 | $23,108 | $3,256 | $19,852 |
| 2018 | $6,839 | $24,551 | $3,006 | $21,545 |
| 2017 | $6,719 | $24,551 | $3,006 | $21,545 |
| 2016 | $6,519 | $24,551 | $3,006 | $21,545 |
| 2015 | $4,777 | $17,795 | $2,755 | $15,040 |
| 2014 | $4,680 | $17,795 | $2,755 | $15,040 |
| 2013 | $5,054 | $19,478 | $2,755 | $16,723 |
Source: Public Records
Map
Nearby Homes
- 2401 Rohlwing Rd
- 2600 Brookwood Way Dr Unit 316
- 2600 Brookwood Way Dr Unit 305
- 2650 Brookwood Way Dr Unit 313
- 2650 Brookwood Way Dr Unit 108
- 3265 Kirchoff Rd Unit 116
- 304 E Tall Trees Ln
- 3345 Kirchoff Rd Unit 5C
- 3100 Town Square Dr Unit 308
- 3100 Town Square Dr Unit 204
- 3135 Town Square Dr Unit 401
- 2705 Park St
- 4406 Euclid Ave Unit 2C
- 2 Croydon on Duxbury
- 3 Holyoke on Auburn
- 2 Stuart on Oxford
- 3306 Trillium Cir Unit 3001
- 1 Harrogate on Oxford
- 3209 Trillium Cir
- 3000 California Ave
- 2301 Flicker Ln
- 2305 Flicker Ln
- 2207 Flicker Ln
- 2307 Flicker Ln
- 2302 Rohlwing Rd
- 2304 Rohlwing Rd
- 2300 Rohlwing Rd
- 2205 Flicker Ln
- 2401 Flicker Ln
- 2306 Rohlwing Rd
- 2206 Rohlwing Rd
- 2302 Flicker Ln
- 2304 Flicker Ln
- 2203 Flicker Ln
- 2300 Flicker Ln
- 2403 Flicker Ln
- 2400 Rohlwing Rd
- 2204 Rohlwing Rd
- 2206 Flicker Ln
- 2306 Flicker Ln
Your Personal Tour Guide
Ask me questions while you tour the home.