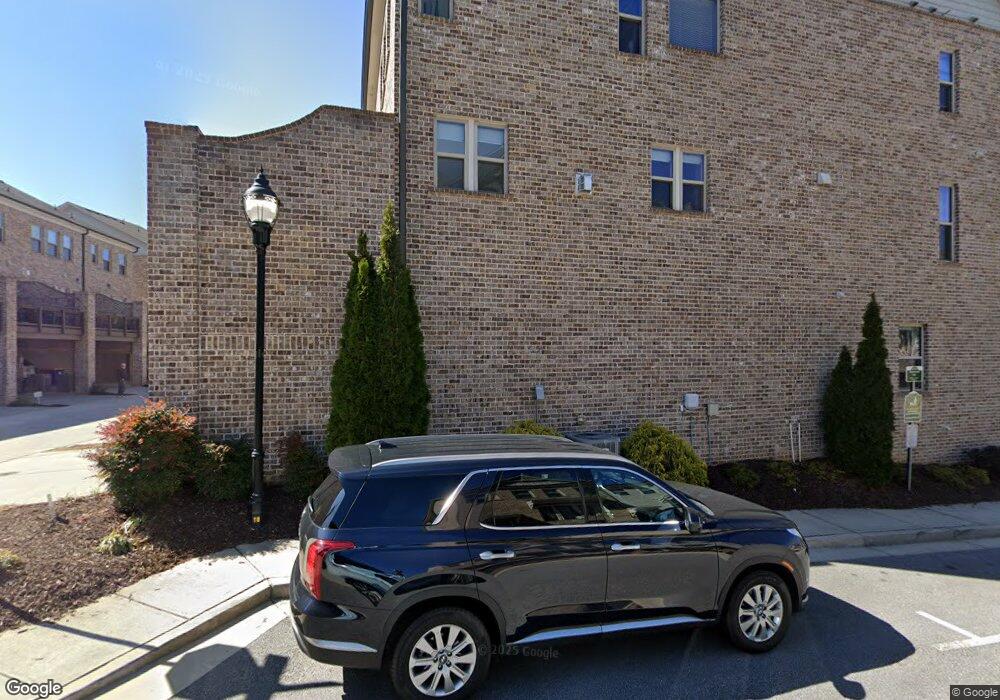
2303 McLean Chase SE Smyrna, GA 30080
Estimated Value: $586,360 - $649,000
3
Beds
4
Baths
2,379
Sq Ft
$262/Sq Ft
Est. Value
About This Home
This home is located at 2303 McLean Chase SE, Smyrna, GA 30080 and is currently estimated at $623,590, approximately $262 per square foot. 2303 McLean Chase SE is a home located in Cobb County with nearby schools including Teasley Elementary School, Campbell Middle School, and Campbell High School.
Ownership History
Date
Name
Owned For
Owner Type
Purchase Details
Closed on
Oct 15, 2021
Sold by
Kirk Hasler
Bought by
Sfr Acquisitions 1 Llc
Current Estimated Value
Purchase Details
Closed on
Feb 26, 2021
Sold by
Chen Yuhan
Bought by
Hasler Kirk Raymond
Home Financials for this Owner
Home Financials are based on the most recent Mortgage that was taken out on this home.
Original Mortgage
$386,400
Interest Rate
2.7%
Mortgage Type
New Conventional
Purchase Details
Closed on
Mar 28, 2018
Sold by
Ashton Atlanta Residential
Bought by
Yuhan Chen
Home Financials for this Owner
Home Financials are based on the most recent Mortgage that was taken out on this home.
Original Mortgage
$300,000
Interest Rate
4.43%
Mortgage Type
New Conventional
Create a Home Valuation Report for This Property
The Home Valuation Report is an in-depth analysis detailing your home's value as well as a comparison with similar homes in the area
Home Values in the Area
Average Home Value in this Area
Purchase History
| Date | Buyer | Sale Price | Title Company |
|---|---|---|---|
| Sfr Acquisitions 1 Llc | $535,000 | Weissman Pc | |
| Hasler Kirk Raymond | $483,000 | None Available | |
| Hasler Kirk Raymond | $483,000 | None Listed On Document | |
| Yuhan Chen | $440,000 | -- |
Source: Public Records
Mortgage History
| Date | Status | Borrower | Loan Amount |
|---|---|---|---|
| Previous Owner | Hasler Kirk Raymond | $386,400 | |
| Previous Owner | Yuhan Chen | $300,000 |
Source: Public Records
Tax History Compared to Growth
Tax History
| Year | Tax Paid | Tax Assessment Tax Assessment Total Assessment is a certain percentage of the fair market value that is determined by local assessors to be the total taxable value of land and additions on the property. | Land | Improvement |
|---|---|---|---|---|
| 2025 | $6,769 | $224,663 | $80,000 | $144,663 |
| 2024 | $6,912 | $229,248 | $80,000 | $149,248 |
| 2023 | $6,327 | $209,836 | $70,000 | $139,836 |
| 2022 | $5,754 | $189,600 | $70,000 | $119,600 |
| 2021 | $5,754 | $189,600 | $70,000 | $119,600 |
| 2020 | $5,754 | $189,600 | $70,000 | $119,600 |
| 2019 | $5,342 | $176,000 | $59,040 | $116,960 |
| 2018 | $3,407 | $112,264 | $52,000 | $60,264 |
Source: Public Records
Map
Nearby Homes
- 2282 McLean Chase SE
- 2380 Montford Place SE
- 3854 Ridgewood Dr SE
- 3916 Ridgewood Dr SE
- 3927 Pineview Dr SE
- 3721 Paces Park Cir SE
- 3927 Allegretto Cir
- 3984 Allegretto Cir
- 3924 Danube Ln
- 3920 Danube Ln
- 3703 Tynemoore Trace SE
- 3908 Danube Ln
- 3900 Danube Ln
- 3933 Danube Ln Unit 224
- 3933 Danube Ln Unit 222
- 2669 Caruso Way
- 2351 Honeysuckle Ln SE
- Marigold Plan at Reverie on Cumberland
- 2303 McLean Chase SE Unit 25
- 2303 McLean Chase SE
- 2299 McLean Chase SE Unit 26
- 2299 McLean Chase SE
- 2307 McLean Chase SE Unit 24
- 2311 McLean Chase SE
- 2315 McLean Chase
- 2289 McLean Chase SE
- 2289 McLean Chase SE
- 0 McLean Chase
- 2285 McLean Chase SE Unit 28
- 2281 McLean Chase SE
- 2281 McLean Chase
- 2302 McLean Chase SE Unit 13
- 2302 McLean Chase SE
- 2298 McLean Chase SE
- 2306 McLean Chase
- 2277 McLean Chase SE
- 2277 McLean Chase SE Unit 30
- 2294 McLean Chase SE Unit 11