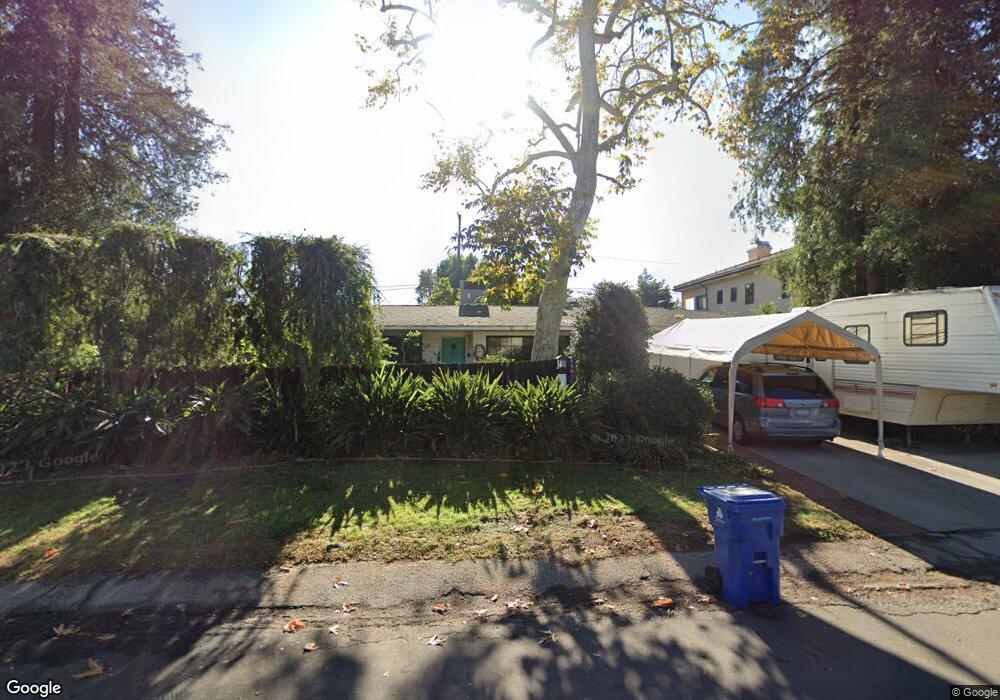
23030 Ostronic Dr Woodland Hills, CA 91367
Estimated Value: $1,009,217 - $1,887,000
2
Beds
1
Bath
1,258
Sq Ft
$1,065/Sq Ft
Est. Value
About This Home
This home is located at 23030 Ostronic Dr, Woodland Hills, CA 91367 and is currently estimated at $1,339,304, approximately $1,064 per square foot. 23030 Ostronic Dr is a home located in Los Angeles County with nearby schools including Woodlake Elementary Community Charter, Woodland Hills Elementary Charter For Enriched Studies, and Hamlin Charter Academy.
Ownership History
Date
Name
Owned For
Owner Type
Purchase Details
Closed on
Jan 26, 2018
Sold by
Mekjian Anna M
Bought by
Mekjian Anna Mary and Mekjian Liftime Benefit Trust
Current Estimated Value
Home Financials for this Owner
Home Financials are based on the most recent Mortgage that was taken out on this home.
Original Mortgage
$100,000
Interest Rate
3.37%
Mortgage Type
Adjustable Rate Mortgage/ARM
Purchase Details
Closed on
Aug 3, 2016
Sold by
Mekjian Michael Z and Mekjian Trust
Bought by
Mekjian Anna Mary and Mekjian Lifetime Benefit Trust
Purchase Details
Closed on
Jul 21, 2011
Sold by
Mekjian Michael Z and Mekjian Trust
Bought by
Mekjian Anna Mary and Mekjian Ostronic Drive Persona
Purchase Details
Closed on
Oct 9, 2007
Sold by
Mekjian Michael
Bought by
Mekjian Michael and Mekjian Trust
Create a Home Valuation Report for This Property
The Home Valuation Report is an in-depth analysis detailing your home's value as well as a comparison with similar homes in the area
Home Values in the Area
Average Home Value in this Area
Purchase History
| Date | Buyer | Sale Price | Title Company |
|---|---|---|---|
| Mekjian Anna Mary | -- | First American Title Company | |
| Mekjian Anna M | -- | First American Title Company | |
| Mekjian Anna M | -- | First American Title Company | |
| Mekjian Anna Mary | -- | None Available | |
| Mekjian Anna Mary | -- | None Available | |
| Mekjian Michael | -- | None Available |
Source: Public Records
Mortgage History
| Date | Status | Borrower | Loan Amount |
|---|---|---|---|
| Closed | Mekjian Anna M | $100,000 |
Source: Public Records
Tax History Compared to Growth
Tax History
| Year | Tax Paid | Tax Assessment Tax Assessment Total Assessment is a certain percentage of the fair market value that is determined by local assessors to be the total taxable value of land and additions on the property. | Land | Improvement |
|---|---|---|---|---|
| 2025 | $1,360 | $92,359 | $51,695 | $40,664 |
| 2024 | $1,360 | $90,549 | $50,682 | $39,867 |
| 2023 | $1,339 | $88,775 | $49,689 | $39,086 |
| 2022 | $1,283 | $87,035 | $48,715 | $38,320 |
| 2021 | $1,262 | $85,329 | $47,760 | $37,569 |
| 2019 | $1,228 | $82,800 | $46,345 | $36,455 |
| 2018 | $1,182 | $81,178 | $45,437 | $35,741 |
| 2016 | $5,735 | $465,369 | $351,734 | $113,635 |
| 2015 | $5,652 | $458,380 | $346,451 | $111,929 |
| 2014 | $5,679 | $449,402 | $339,665 | $109,737 |
Source: Public Records
Map
Nearby Homes
- 23042 Ostronic Dr
- 22963 Ostronic Dr
- 23110 Canzonet St
- 23143 Leonora Dr
- 23003 Mariano St
- 5201 Rigoletto St
- 23245 Gonzales Dr
- 22809 Del Valle St Unit 8
- 22942 Crespi St
- 23246 Canzonet St
- 23248 Canzonet St
- 5350 Fallbrook Ave
- 22931 Dolorosa St
- 23151 Bigler St
- 23143 Dolorosa St
- 4941 Rigoletto St
- 22723 Leonora Dr
- 23312 Ostronic Dr
- 4933 Bruges Ave
- 23242 Burbank Blvd
- 23038 Ostronic Dr
- 23022 Ostronic Dr
- 23033 Leonora Dr
- 23023 Leonora Dr
- 23035 Leonora Dr
- 23014 Ostronic Dr
- 23015 Leonora Dr
- 23033 Ostronic Dr
- 23043 Leonora Dr
- 23048 Ostronic Dr
- 23025 Ostronic Dr
- 23039 Ostronic Dr
- 23049 Leonora Dr
- 23009 Leonora Dr
- 23055 Ostronic Dr
- 23002 Ostronic Dr
- 23044 Canzonet St
- 23055 Leonora Dr
- 23014 Leonora Dr
- 23062 Ostronic Dr