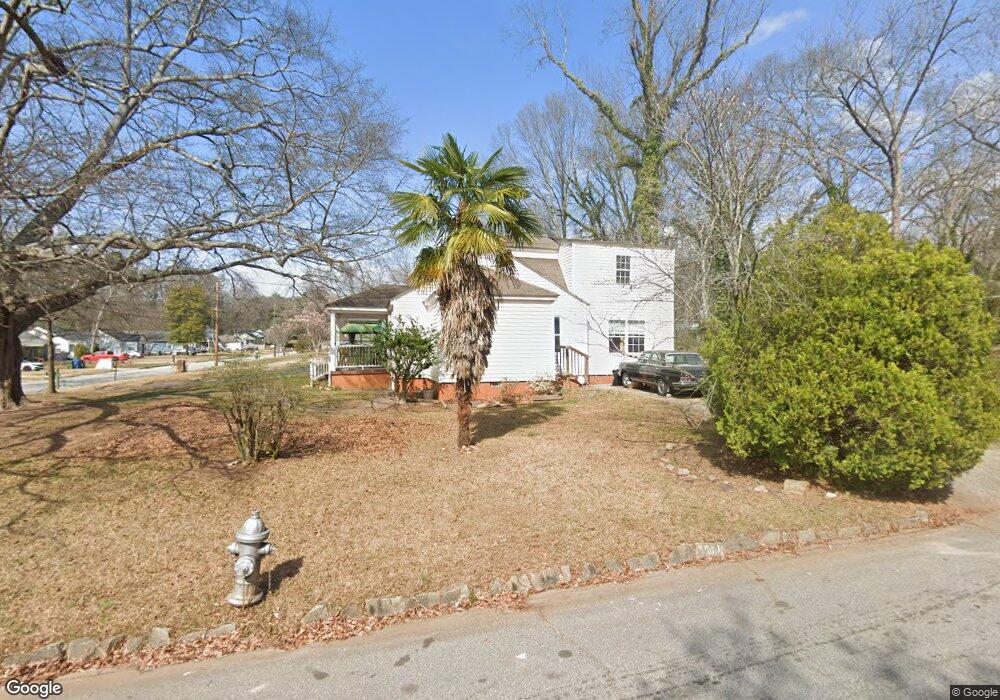
2304 Jernigan Dr SE Unit 2 Atlanta, GA 30315
Lakewood NeighborhoodEstimated Value: $295,212 - $333,000
3
Beds
2
Baths
2,072
Sq Ft
$152/Sq Ft
Est. Value
About This Home
This home is located at 2304 Jernigan Dr SE Unit 2, Atlanta, GA 30315 and is currently estimated at $315,053, approximately $152 per square foot. 2304 Jernigan Dr SE Unit 2 is a home located in Fulton County with nearby schools including Dobbs Elementary School, Long Middle School, and South Atlanta High School.
Ownership History
Date
Name
Owned For
Owner Type
Purchase Details
Closed on
Apr 28, 2021
Sold by
Moss Leon
Bought by
Moss Leon and Parr Pristine D
Current Estimated Value
Home Financials for this Owner
Home Financials are based on the most recent Mortgage that was taken out on this home.
Original Mortgage
$136,482
Outstanding Balance
$123,687
Interest Rate
3.1%
Mortgage Type
FHA
Estimated Equity
$191,366
Purchase Details
Closed on
Oct 15, 2007
Sold by
Hud & Housing Of Urban Dev
Bought by
Peters Len
Purchase Details
Closed on
Sep 7, 2004
Sold by
Citimortgage
Bought by
Secretary Of Hud
Purchase Details
Closed on
Nov 14, 2003
Sold by
Equity Secured Investment Corp
Bought by
Tinch Montessia
Home Financials for this Owner
Home Financials are based on the most recent Mortgage that was taken out on this home.
Original Mortgage
$152,605
Interest Rate
5.77%
Mortgage Type
VA
Purchase Details
Closed on
Jul 2, 2002
Sold by
Benton Edward
Bought by
Equity Security Inv Corp
Create a Home Valuation Report for This Property
The Home Valuation Report is an in-depth analysis detailing your home's value as well as a comparison with similar homes in the area
Home Values in the Area
Average Home Value in this Area
Purchase History
| Date | Buyer | Sale Price | Title Company |
|---|---|---|---|
| Moss Leon | -- | -- | |
| Moss Leon | $139,000 | -- | |
| Peters Len | -- | -- | |
| Secretary Of Hud | -- | -- | |
| Citimortgage | $158,970 | -- | |
| Tinch Montessia | $155,000 | -- | |
| Equity Security Inv Corp | $44,600 | -- |
Source: Public Records
Mortgage History
| Date | Status | Borrower | Loan Amount |
|---|---|---|---|
| Open | Moss Leon | $136,482 | |
| Closed | Moss Leon | $136,482 | |
| Previous Owner | Tinch Montessia | $152,605 |
Source: Public Records
Tax History Compared to Growth
Tax History
| Year | Tax Paid | Tax Assessment Tax Assessment Total Assessment is a certain percentage of the fair market value that is determined by local assessors to be the total taxable value of land and additions on the property. | Land | Improvement |
|---|---|---|---|---|
| 2025 | $2,326 | $111,360 | $27,400 | $83,960 |
| 2023 | $4,968 | $120,000 | $34,080 | $85,920 |
| 2022 | $3,474 | $85,840 | $11,000 | $74,840 |
| 2021 | $2,512 | $62,000 | $7,880 | $54,120 |
| 2020 | $2,312 | $56,440 | $9,280 | $47,160 |
| 2019 | $491 | $41,280 | $5,720 | $35,560 |
| 2018 | $1,018 | $24,600 | $4,400 | $20,200 |
| 2017 | $1,023 | $23,680 | $4,240 | $19,440 |
| 2016 | $1,025 | $23,680 | $4,240 | $19,440 |
| 2015 | $1,520 | $23,680 | $4,240 | $19,440 |
| 2014 | $1,074 | $23,680 | $4,240 | $19,440 |
Source: Public Records
Map
Nearby Homes
- 2318 Browns Mill Rd SE
- 444 Sargent Dr SE
- 2242 Jernigan Dr SE
- 2306 Carey Dr SE
- 568 Mcwilliams Rd SE
- 2209 Browns Mill Rd SE
- 2239 Carey Dr SE
- 2203 Browns Mill Rd SE
- 388 Sargent Dr SE
- 2197 Jernigan Dr SE
- 585 Mcwilliams Rd SE Unit 2003
- 585 Mcwilliams Rd SE Unit 1406
- 585 Mcwilliams Rd SE Unit 604
- 2276 Sargent Place SE
- 322 E Rhinehill Rd SE
- 319 E Rhinehill Rd SE
- 2126 Jernigan Dr SE
- 309 E Rhinehill Rd SE
- 2300 Jernigan Dr SE
- 2294 Jernigan Dr SE
- 2325 Jernigan Place SE
- 2317 Jernigan Place SE
- 2305 Burroughs Ave SE
- 2333 Jernigan Place SE
- 2299 Burroughs Ave SE
- 2288 Jernigan Dr SE
- 2303 Jernigan Dr SE
- 2293 Burroughs Ave SE
- 2299 Jernigan Dr SE
- 2311 Jernigan Dr SE
- 2295 Jernigan Dr SE
- 2280 Jernigan Dr SE Unit 2
- 2341 Jernigan Place SE
- 2287 Burroughs Ave SE
- 2289 Jernigan Dr SE
- 0 Jernigan Place SE Unit 7464817
- 0 Jernigan Place SE Unit 8185643
- 0 Jernigan Place SE Unit 8098483