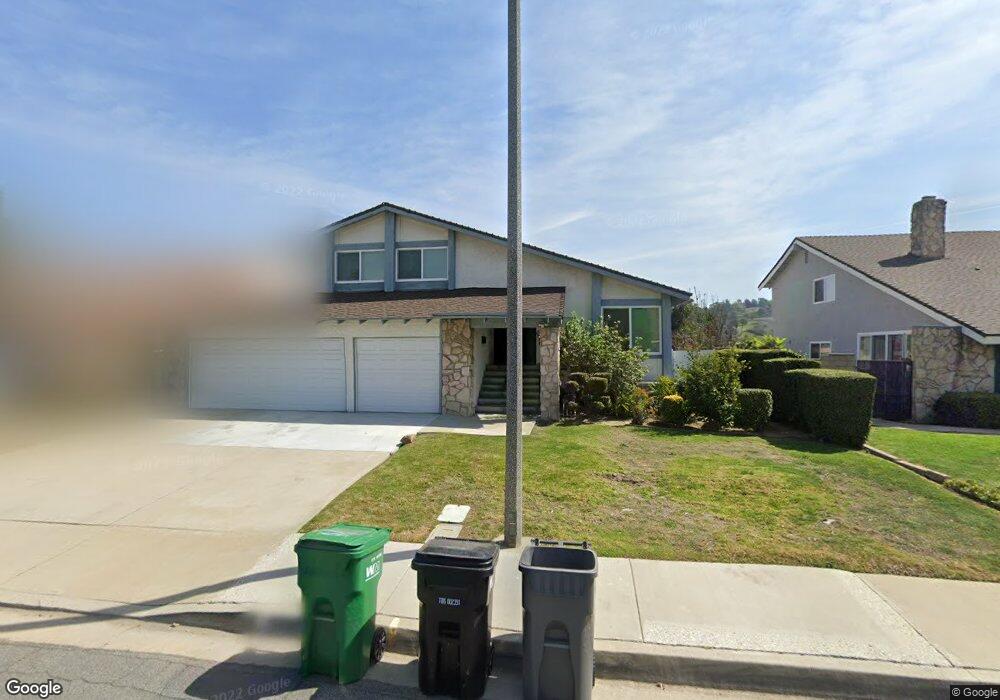
23047 Aspen Knoll Dr Diamond Bar, CA 91765
Estimated Value: $1,181,287 - $1,393,000
4
Beds
3
Baths
2,557
Sq Ft
$520/Sq Ft
Est. Value
About This Home
This home is located at 23047 Aspen Knoll Dr, Diamond Bar, CA 91765 and is currently estimated at $1,329,822, approximately $520 per square foot. 23047 Aspen Knoll Dr is a home located in Los Angeles County with nearby schools including Maple Hill Elementary School, Chaparral Middle School, and Diamond Bar High School.
Ownership History
Date
Name
Owned For
Owner Type
Purchase Details
Closed on
Jun 5, 2002
Sold by
Lee Chung Chow
Bought by
Teng Vincent C and Wang Yuwen
Current Estimated Value
Home Financials for this Owner
Home Financials are based on the most recent Mortgage that was taken out on this home.
Original Mortgage
$201,000
Outstanding Balance
$85,288
Interest Rate
6.86%
Estimated Equity
$1,244,534
Purchase Details
Closed on
Feb 7, 2001
Sold by
Lee Hsieh Yuh Chyn
Bought by
Lee Chung Chow
Purchase Details
Closed on
Jul 17, 1996
Sold by
Jeffus Charles D and Jeffus Sandra J
Bought by
Lee Chung Chow and Lee Hsieh Yuh Chyn
Home Financials for this Owner
Home Financials are based on the most recent Mortgage that was taken out on this home.
Original Mortgage
$159,250
Interest Rate
5.95%
Purchase Details
Closed on
Jun 3, 1994
Sold by
Mission Hills Mtg Corp
Bought by
Federal National Mortgage Association
Create a Home Valuation Report for This Property
The Home Valuation Report is an in-depth analysis detailing your home's value as well as a comparison with similar homes in the area
Home Values in the Area
Average Home Value in this Area
Purchase History
| Date | Buyer | Sale Price | Title Company |
|---|---|---|---|
| Teng Vincent C | $402,000 | Chicago Title | |
| Lee Chung Chow | -- | -- | |
| Lee Chung Chow | $245,000 | Gateway Title Company | |
| Federal National Mortgage Association | -- | Continental Lawyers Title Co |
Source: Public Records
Mortgage History
| Date | Status | Borrower | Loan Amount |
|---|---|---|---|
| Open | Teng Vincent C | $201,000 | |
| Previous Owner | Lee Chung Chow | $159,250 |
Source: Public Records
Tax History Compared to Growth
Tax History
| Year | Tax Paid | Tax Assessment Tax Assessment Total Assessment is a certain percentage of the fair market value that is determined by local assessors to be the total taxable value of land and additions on the property. | Land | Improvement |
|---|---|---|---|---|
| 2025 | $7,353 | $593,854 | $268,267 | $325,587 |
| 2024 | $7,353 | $582,210 | $263,007 | $319,203 |
| 2023 | $7,179 | $570,795 | $257,850 | $312,945 |
| 2022 | $7,029 | $559,604 | $252,795 | $306,809 |
| 2021 | $6,891 | $548,633 | $247,839 | $300,794 |
| 2019 | $6,673 | $532,362 | $240,489 | $291,873 |
| 2018 | $6,398 | $521,924 | $235,774 | $286,150 |
| 2016 | $5,918 | $501,659 | $226,619 | $275,040 |
| 2015 | $5,952 | $494,124 | $223,215 | $270,909 |
| 2014 | $5,957 | $484,446 | $218,843 | $265,603 |
Source: Public Records
Map
Nearby Homes
- 23072 Aspen Knoll Dr
- 1543 S Diamond Bar Blvd Unit 20
- 1409 Meadow Glen Rd
- 22905 Colombard Ln Unit 5
- 1320 S Diamond Bar Blvd Unit B
- 1327 Solera Ln Unit 6
- 23064 Paseo de Terrado Unit 2
- 23408 Amberwick Place
- 23328 Forest Canyon Dr
- 1221 Porto Grande Unit 4
- 23431 Ridge Line Rd
- 1386 Rolling Knoll Rd
- 1229 Porto Grande Unit 4
- 1643 Bronze Knoll Rd
- 23509 Ridge Line Rd
- 1147 Chisolm Trail Dr
- 883 Terrace Ln W Unit 1
- 1511 Deer Crossing Dr
- 22499 Birds Eye Dr
- 23640 Monument Canyon Dr
- 23051 Aspen Knoll Dr
- 23041 Aspen Knoll Dr
- 23057 Aspen Knoll Dr
- 23037 Aspen Knoll Dr
- 1511 S Diamond Bar Blvd
- 23046 Aspen Knoll Dr
- 1515 S Diamond Bar Blvd
- 23050 Aspen Knoll Dr
- 23063 Aspen Knoll Dr
- 23031 Aspen Knoll Dr
- 23038 Aspen Knoll Dr
- 23056 Aspen Knoll Dr
- 1525 S Diamond Bar Blvd Unit 9
- 23062 Aspen Knoll Dr
- 23028 Aspen Knoll Dr
- 23069 Aspen Knoll Dr
- 23027 Aspen Knoll Dr
- 1529 S Diamond Bar Blvd
- 1322 Holly Leaf Way
- 1316 Holly Leaf Way