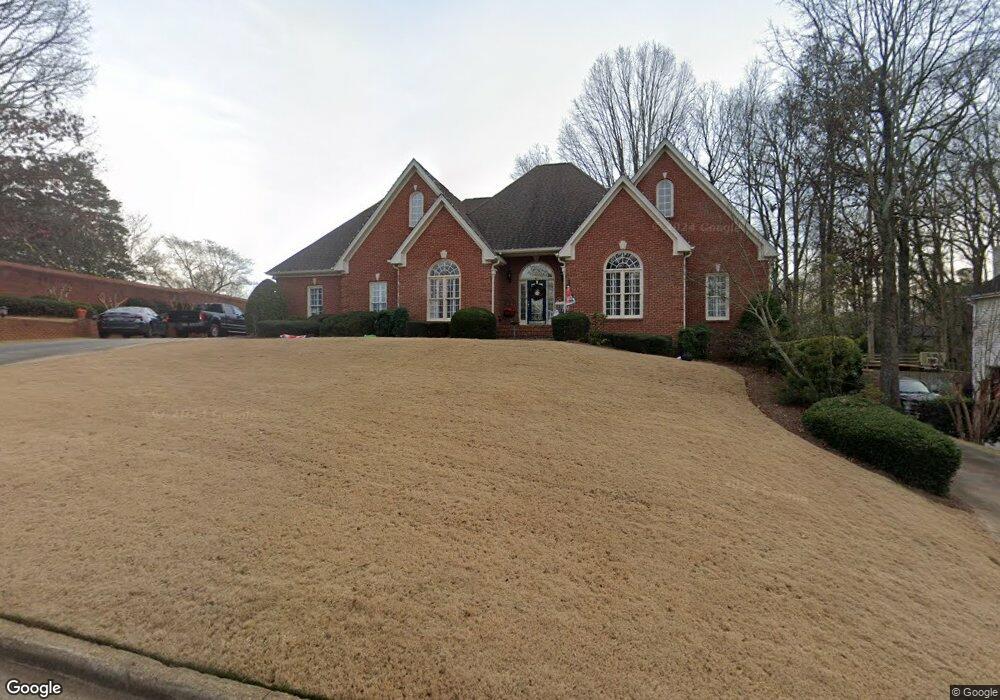
2305 Brickton Station Buford, GA 30518
Estimated Value: $615,000 - $775,000
5
Beds
4
Baths
3,520
Sq Ft
$199/Sq Ft
Est. Value
About This Home
This home is located at 2305 Brickton Station, Buford, GA 30518 and is currently estimated at $698,820, approximately $198 per square foot. 2305 Brickton Station is a home located in Gwinnett County with nearby schools including Buford Elementary School, Buford Senior Academy, and Buford Academy.
Ownership History
Date
Name
Owned For
Owner Type
Purchase Details
Closed on
May 5, 2023
Sold by
Reed J Garrett
Bought by
Henderson Jeffery Grant and Henderson Angela R
Current Estimated Value
Purchase Details
Closed on
Jul 5, 2016
Sold by
First Citizens Bank
Bought by
Antebi Eric and Henderson Cameron
Home Financials for this Owner
Home Financials are based on the most recent Mortgage that was taken out on this home.
Original Mortgage
$173,537
Interest Rate
3.48%
Purchase Details
Closed on
Sep 19, 2014
Sold by
Reed Reba J
Bought by
Reed J Garrett
Purchase Details
Closed on
Apr 14, 2000
Sold by
Reed Garrett
Bought by
Reed Reba J
Home Financials for this Owner
Home Financials are based on the most recent Mortgage that was taken out on this home.
Original Mortgage
$225,000
Interest Rate
8.27%
Mortgage Type
New Conventional
Create a Home Valuation Report for This Property
The Home Valuation Report is an in-depth analysis detailing your home's value as well as a comparison with similar homes in the area
Home Values in the Area
Average Home Value in this Area
Purchase History
| Date | Buyer | Sale Price | Title Company |
|---|---|---|---|
| Henderson Jeffery Grant | -- | -- | |
| Antebi Eric | -- | -- | |
| Reed J Garrett | -- | -- | |
| Reed Reba J | -- | -- |
Source: Public Records
Mortgage History
| Date | Status | Borrower | Loan Amount |
|---|---|---|---|
| Previous Owner | Antebi Eric | $173,537 | |
| Previous Owner | Antebi Eric | -- | |
| Previous Owner | Reed Reba J | $225,000 |
Source: Public Records
Tax History Compared to Growth
Tax History
| Year | Tax Paid | Tax Assessment Tax Assessment Total Assessment is a certain percentage of the fair market value that is determined by local assessors to be the total taxable value of land and additions on the property. | Land | Improvement |
|---|---|---|---|---|
| 2024 | $3,941 | $284,400 | $44,000 | $240,400 |
| 2023 | $3,941 | $300,840 | $44,000 | $256,840 |
| 2022 | $0 | $240,560 | $28,400 | $212,160 |
| 2021 | $1,545 | $182,760 | $28,400 | $154,360 |
| 2020 | $1,545 | $182,760 | $28,400 | $154,360 |
| 2019 | $1,396 | $160,000 | $22,800 | $137,200 |
| 2018 | $1,396 | $160,000 | $22,800 | $137,200 |
| 2016 | $1,383 | $142,840 | $22,800 | $120,040 |
| 2015 | $1,426 | $120,720 | $14,800 | $105,920 |
| 2014 | $1,444 | $120,720 | $14,800 | $105,920 |
Source: Public Records
Map
Nearby Homes
- 4245 Woodland Bank Blvd
- 4316 Woodland Bank Blvd
- 2267 Pink Hawthorn Dr
- 4238 Hamilton Mill Rd
- 18 Buford Village Walk
- 21 Buford Village Walk
- 2446 Thrasher Rd
- 2255 Buford Hwy
- 2255 Buford Hwy
- 2398 E Maddox Rd
- 190 Maddox Rd
- 4895 Sterling Close
- 4831 Miller Hill Rd
- 2101 E Maddox Rd
- 2678 N Bogan Rd
- 2307 Loughridge Dr
- 103 Maddox Rd
- 4017 S South Bogan Rd
- 2051 Harvester Ln
- 2295 Brickton Station
- 4360 Old Hamilton Mill Rd
- 000 Old Hamilton Mill Rd
- 2285 Brickton Station
- 2290 Brickton Station
- 2280 Woodbriar Dr
- 2300 Brickton Station
- 2275 Brickton Station
- 2280 Brickton Station
- 2274 Woodbriar Dr
- 2268 Woodbriar Dr
- 2255 Brickton Station
- 4395 Old Hamilton Mill Rd
- 2262 Woodbriar Dr
- 4385 Hamilton Mill Rd
- 4347 Old Hamilton Mill Rd
- 2256 Woodbriar Dr
- 2345 Hillbriar Dr
- 2245 Brickton Station
- 2520 Heritage Ct