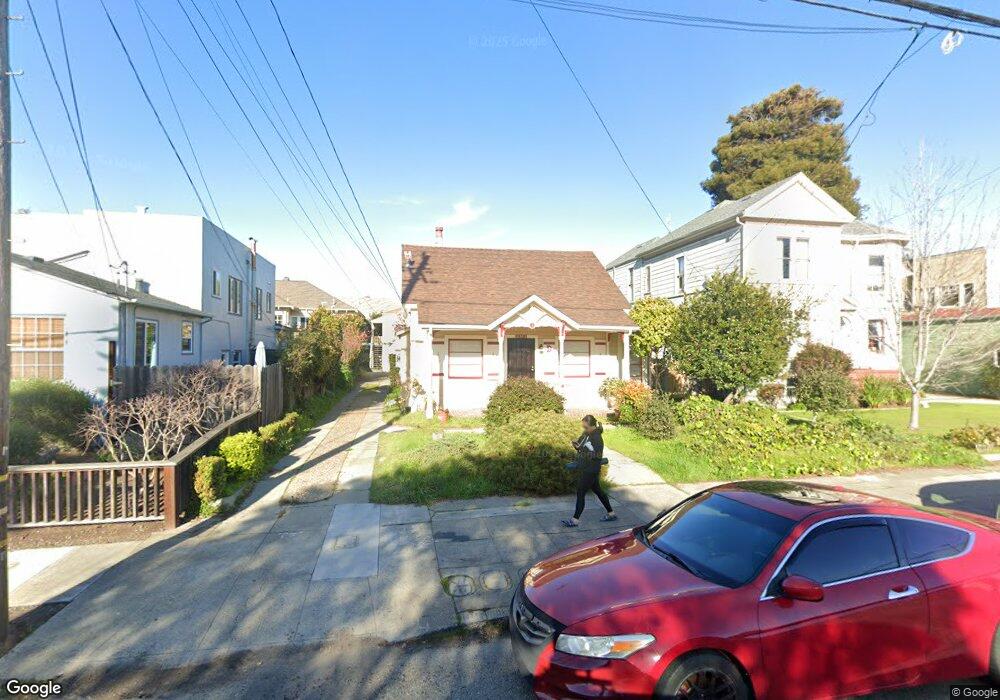
2305 San Jose Ave Alameda, CA 94501
South Shore NeighborhoodEstimated Value: $1,324,000 - $1,592,000
2
Beds
1
Bath
600
Sq Ft
$2,448/Sq Ft
Est. Value
About This Home
This home is located at 2305 San Jose Ave, Alameda, CA 94501 and is currently estimated at $1,468,545, approximately $2,447 per square foot. 2305 San Jose Ave is a home located in Alameda County with nearby schools including Love Elementary, Will C. Wood Middle School, and Alameda High School.
Ownership History
Date
Name
Owned For
Owner Type
Purchase Details
Closed on
Apr 14, 2017
Sold by
Kaylen Sharon and The Marion H Mcsweeney Living
Bought by
Chuah Cheong L and Tan Lorena H
Current Estimated Value
Home Financials for this Owner
Home Financials are based on the most recent Mortgage that was taken out on this home.
Original Mortgage
$805,000
Outstanding Balance
$681,620
Interest Rate
4.87%
Mortgage Type
Adjustable Rate Mortgage/ARM
Estimated Equity
$786,925
Purchase Details
Closed on
Jan 26, 2000
Sold by
Hinds David R and Hinds Alice J
Bought by
Mcsweeney Marion H and The Marion H Mcsweeney Living
Purchase Details
Closed on
Apr 7, 1999
Sold by
Perry Marion H
Bought by
Perry James D and Perry Marion H
Purchase Details
Closed on
Feb 2, 1999
Sold by
Hinds R M & Margaret Family Trust and Marion H
Bought by
Hinds David R and Hinds Alice J
Create a Home Valuation Report for This Property
The Home Valuation Report is an in-depth analysis detailing your home's value as well as a comparison with similar homes in the area
Home Values in the Area
Average Home Value in this Area
Purchase History
| Date | Buyer | Sale Price | Title Company |
|---|---|---|---|
| Chuah Cheong L | $1,150,000 | Chicago Title Company | |
| Mcsweeney Marion H | $190,500 | North American Title Co | |
| Perry James D | -- | -- | |
| Hinds David R | -- | -- |
Source: Public Records
Mortgage History
| Date | Status | Borrower | Loan Amount |
|---|---|---|---|
| Open | Chuah Cheong L | $805,000 |
Source: Public Records
Tax History Compared to Growth
Tax History
| Year | Tax Paid | Tax Assessment Tax Assessment Total Assessment is a certain percentage of the fair market value that is determined by local assessors to be the total taxable value of land and additions on the property. | Land | Improvement |
|---|---|---|---|---|
| 2025 | $19,791 | $1,334,643 | $400,393 | $934,250 |
| 2024 | $19,791 | $1,308,481 | $392,544 | $915,937 |
| 2023 | $19,029 | $1,282,824 | $384,847 | $897,977 |
| 2022 | $18,591 | $1,257,674 | $377,302 | $880,372 |
| 2021 | $18,122 | $1,233,017 | $369,905 | $863,112 |
| 2020 | $17,888 | $1,220,380 | $366,114 | $854,266 |
| 2019 | $17,051 | $1,196,460 | $358,938 | $837,522 |
| 2018 | $16,614 | $1,173,000 | $351,900 | $821,100 |
| 2017 | $6,842 | $353,427 | $105,942 | $247,485 |
| 2016 | $6,809 | $346,498 | $103,865 | $242,633 |
| 2015 | $6,763 | $341,294 | $102,305 | $238,989 |
| 2014 | $6,733 | $334,609 | $100,301 | $234,308 |
Source: Public Records
Map
Nearby Homes
- 1251 Park St
- 2308 Encinal Ave
- 954 Park St
- 2417 Marti Rae Ct
- 840 Oak St
- 935 Park St
- 1100 Park Ave
- 2209 Otis Dr Unit L
- 1210 Broadway Unit A
- 2151 Alameda Ave
- 1024 Regent St
- 2120 Encinal Ave
- 2137 Otis Dr Unit 322
- 2137 Otis Dr Unit 111
- 2216 Santa Clara Ave
- 2431 Roosevelt Dr
- 2620 Encinal Ave
- 2119 Alameda Ave
- 2060 San Antonio Ave
- 2106 Otis Dr Unit D
- 2303 San Jose Ave
- 1010 Oak St
- 1209 Park St
- 1024 Oak St
- 1215 Park St
- 2271 San Jose Ave
- 1028 Oak St
- 2269 San Jose Ave
- 2308 San Antonio Ave
- 1011 Oak St
- 2304 San Jose Ave
- 1015 Oak St
- 2300 San Jose Ave
- 2300 San Antonio Ave
- 1017 Oak St
- 2265 San Jose Ave
- 2312 San Antonio Ave
- 2270 San Antonio Ave
- 2316 San Antonio Ave
- 2270 San Jose Ave