
Seller's Agent in 2026
Mike Happel
Happel, Inc., REALTORS
(217) 224-8418
92 in this area
105 Total Sales
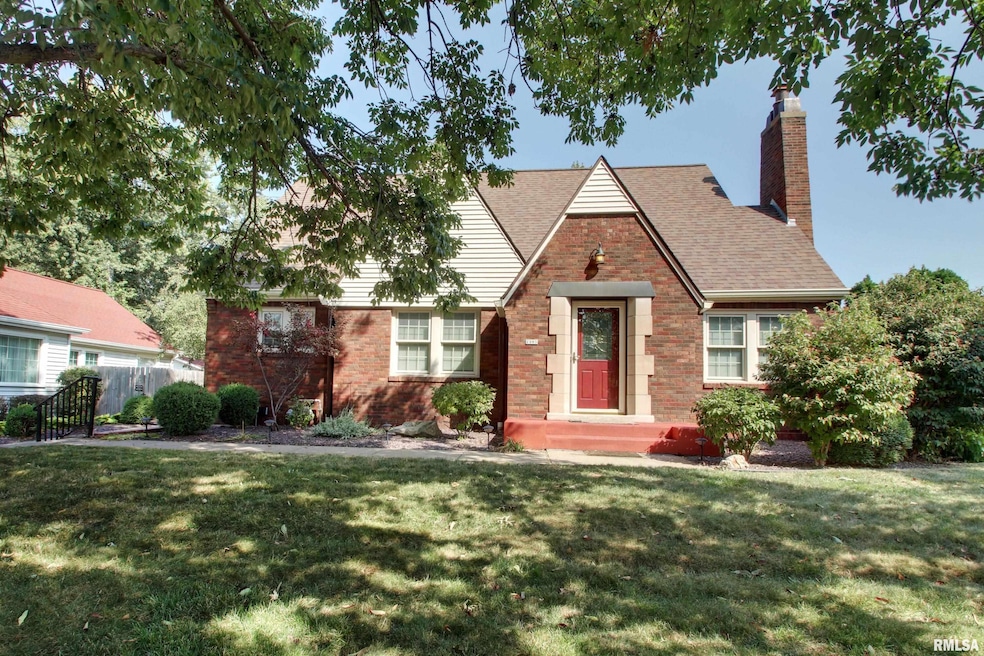


A beautiful and well maintained home waiting for you. Extremely well built 1.5 Story with a finished basement that has an extra kitchen. There are two fireplaces for your enjoyment. Very nice location close to al kinds of amenities. Extra large second floor area with den and a large bedroom. So many recent update updates including new roof, gutters, brick tuck pointing, and storm doors. Recent interior updates include such items as instant hot water, new AC unit on second floor, new kitchen counters, floor and microwave. Theses items are all very recent and many other items in the last several years
Last Agent to Sell the Property
Happel, Inc., REALTORS Brokerage Phone: 217-224-8383 License #471002515 Listed on: 09/11/2025
Last Buyer's Agent
Non-Member Agent RMLSA
Non-MLS
| Date | Event | Price | List to Sale | Price per Sq Ft | Prior Sale |
|---|---|---|---|---|---|
| 01/23/2026 01/23/26 | Sold | $222,000 | -7.5% | $78 / Sq Ft | |
| 12/15/2025 12/15/25 | Pending | -- | -- | -- | |
| 12/02/2025 12/02/25 | For Sale | $239,900 | +8.1% | $84 / Sq Ft | |
| 12/02/2025 12/02/25 | Off Market | $222,000 | -- | -- | |
| 11/11/2025 11/11/25 | Price Changed | $239,900 | -5.9% | $84 / Sq Ft | |
| 09/29/2025 09/29/25 | Price Changed | $255,000 | -5.6% | $90 / Sq Ft | |
| 09/11/2025 09/11/25 | For Sale | $270,000 | +54.4% | $95 / Sq Ft | |
| 05/01/2017 05/01/17 | Sold | $174,900 | 0.0% | -- | View Prior Sale |
| 04/01/2017 04/01/17 | Pending | -- | -- | -- | |
| 02/19/2017 02/19/17 | For Sale | $174,900 | -- | -- |
| Year | Tax Paid | Tax Assessment Tax Assessment Total Assessment is a certain percentage of the fair market value that is determined by local assessors to be the total taxable value of land and additions on the property. | Land | Improvement |
|---|---|---|---|---|
| 2024 | $3,657 | $73,600 | $5,430 | $68,170 |
| 2023 | $3,657 | $68,280 | $5,040 | $63,240 |
| 2022 | $3,401 | $63,760 | $4,710 | $59,050 |
| 2021 | $3,328 | $61,300 | $4,620 | $56,680 |
| 2020 | $3,248 | $60,100 | $4,530 | $55,570 |
| 2019 | $3,177 | $59,450 | $4,480 | $54,970 |
| 2018 | $3,134 | $58,290 | $4,390 | $53,900 |
| 2017 | $2,564 | $48,630 | $4,350 | $44,280 |
| 2016 | $2,503 | $46,660 | $4,180 | $42,480 |
| 2015 | $2,369,580 | $46,660 | $4,180 | $42,480 |
| 2012 | $2,432 | $45,100 | $4,040 | $41,060 |
Seller's Agent in 2026
Mike Happel
Happel, Inc., REALTORS
(217) 224-8418
92 in this area
105 Total Sales
N
Buyer's Agent in 2026
Non-Member Agent RMLSA
Non-MLS
D
Seller's Agent in 2017
Dave Grimm
IN BETWEEN OFFICES
O
Buyer's Agent in 2017
Out of Area Out of Area
OUT OF AREA FIRM
Source: RMLS Alliance
MLS Number: CA1039130
APN: 23-5-2224-000-00
Disclaimer: Certain information contained herein is derived from information provided by parties other than Homes.com. All information provided is deemed reliable, but is not guaranteed to be accurate and should be independently verified.
![]() Based on information submitted to the MLS GRID. All data is obtained from various sources and may not have been verified by broker or MLS GRID. Supplied Open House Information is subject to change without notice. All information should be independently reviewed and verified for accuracy. Properties may or may not be listed by the office/agent presenting the information. Some IDX listings have been excluded from this website.IDX information is provided exclusively for personal, non-commercial use, and may not be used for any purpose other than to identify prospective properties consumers may be interested in purchasing. Information is deemed reliable but not guaranteed.
Based on information submitted to the MLS GRID. All data is obtained from various sources and may not have been verified by broker or MLS GRID. Supplied Open House Information is subject to change without notice. All information should be independently reviewed and verified for accuracy. Properties may or may not be listed by the office/agent presenting the information. Some IDX listings have been excluded from this website.IDX information is provided exclusively for personal, non-commercial use, and may not be used for any purpose other than to identify prospective properties consumers may be interested in purchasing. Information is deemed reliable but not guaranteed.
Based on information submitted to the MLS GRID
Ask me questions while you tour the home.