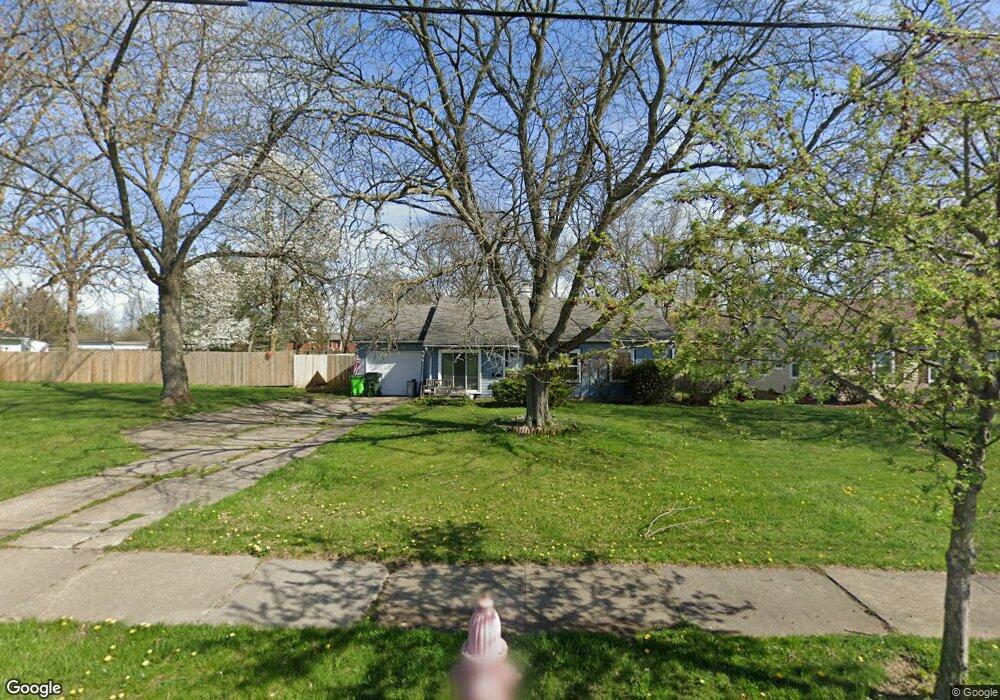
23065 Cranfield Rd Bedford, OH 44146
Estimated Value: $162,000 - $181,000
3
Beds
1
Bath
1,102
Sq Ft
$153/Sq Ft
Est. Value
About This Home
This home is located at 23065 Cranfield Rd, Bedford, OH 44146 and is currently estimated at $168,240, approximately $152 per square foot. 23065 Cranfield Rd is a home located in Cuyahoga County with nearby schools including Heskett Middle School, Bedford High School, and Ohio College Preparatory School.
Ownership History
Date
Name
Owned For
Owner Type
Purchase Details
Closed on
Feb 11, 1999
Sold by
Decaprio Brian K
Bought by
Decaprio Brian K and Decaprio Bonny
Current Estimated Value
Home Financials for this Owner
Home Financials are based on the most recent Mortgage that was taken out on this home.
Original Mortgage
$75,950
Outstanding Balance
$15,789
Interest Rate
6.88%
Estimated Equity
$152,451
Purchase Details
Closed on
Nov 26, 1997
Sold by
Zeller John M
Bought by
Decaprio Brian K
Home Financials for this Owner
Home Financials are based on the most recent Mortgage that was taken out on this home.
Original Mortgage
$61,350
Interest Rate
7.45%
Mortgage Type
FHA
Purchase Details
Closed on
Jun 18, 1986
Sold by
Zeller Helene E and Zeller John M
Bought by
Zeller John M
Purchase Details
Closed on
Jan 1, 1975
Bought by
Zeller Helene E and Zeller John M
Create a Home Valuation Report for This Property
The Home Valuation Report is an in-depth analysis detailing your home's value as well as a comparison with similar homes in the area
Home Values in the Area
Average Home Value in this Area
Purchase History
We collect this data history from publicly available records. To have your information removed, we recommend requesting removal directly through your county’s website.
| Date | Buyer | Sale Price | Title Company |
|---|---|---|---|
| Decaprio Brian K | -- | Tower City Title Agency Inc | |
| Decaprio Brian K | $66,000 | -- | |
| Zeller John M | $40,600 | -- | |
| Zeller Helene E | -- | -- |
Source: Public Records
Mortgage History
We collect this data history from publicly available records. To have your information removed, we recommend requesting removal directly through your county’s website.
| Date | Status | Borrower | Loan Amount |
|---|---|---|---|
| Open | Decaprio Brian K | $75,950 | |
| Closed | Decaprio Brian K | $61,350 | |
| Closed | Decaprio Brian K | $10,000 |
Source: Public Records
Tax History
| Year | Tax Paid | Tax Assessment Tax Assessment Total Assessment is a certain percentage of the fair market value that is determined by local assessors to be the total taxable value of land and additions on the property. | Land | Improvement |
|---|---|---|---|---|
| 2025 | $3,150 | $44,205 | $11,760 | $32,445 |
| 2024 | $3,151 | $44,205 | $11,760 | $32,445 |
| 2023 | $2,761 | $33,530 | $7,700 | $25,830 |
| 2022 | $2,414 | $33,530 | $7,700 | $25,830 |
| 2021 | $2,388 | $33,530 | $7,700 | $25,830 |
| 2020 | $2,289 | $28,910 | $6,650 | $22,260 |
| 2019 | $2,222 | $82,600 | $19,000 | $63,600 |
| 2018 | $2,287 | $28,910 | $6,650 | $22,260 |
| 2017 | $2,385 | $29,480 | $8,230 | $21,250 |
| 2016 | $2,366 | $29,480 | $8,230 | $21,250 |
| 2015 | $2,362 | $29,480 | $8,230 | $21,250 |
| 2014 | $2,362 | $29,480 | $8,230 | $21,250 |
Source: Public Records
Map
Nearby Homes
- 5437 Bartlett Rd
- 5319 Fairtree Rd
- 23540 Cannon Rd
- 23100 Rockside Rd
- 21860 Louis Rd
- 5696 Columbia Dr
- 21506 Kenyon Dr
- 20732 Applegate Rd
- 21202 Gardenview Dr
- 23781 Columbus Rd
- 21202 Hillgrove Ave
- 21104 Clare Ave
- 4914 Green Rd
- 24051 Columbus Rd
- 568 Heather Ln
- 23755 Banbury Cir
- 20648 Donny Brook Rd
- 4878 Banbury Ct Unit K (12)
- 0 Miles Rd Unit 5188561
- 471 Columbus St
- 23105 Cranfield Rd
- 22985 Cranfield Rd
- 23145 Cranfield Rd
- 23185 Cranfield Rd
- 5369 Bartlett Rd
- 5363 Bartlett Rd
- 23140 Cranfield Rd
- 23225 Cranfield Rd
- 5333 Bartlett Rd
- 23180 Cranfield Rd
- 5399 Bartlett Rd
- 23265 Cranfield Rd
- 5404 Millbrook Rd
- 23260 Cranfield Rd
- 23305 Cranfield Rd
- 5360 Bartlett Rd
- 5370 Bartlett Rd
- 5338 Bartlett Rd
- 23300 Cranfield Rd
- 5330 Bartlett Rd
Your Personal Tour Guide
Ask me questions while you tour the home.