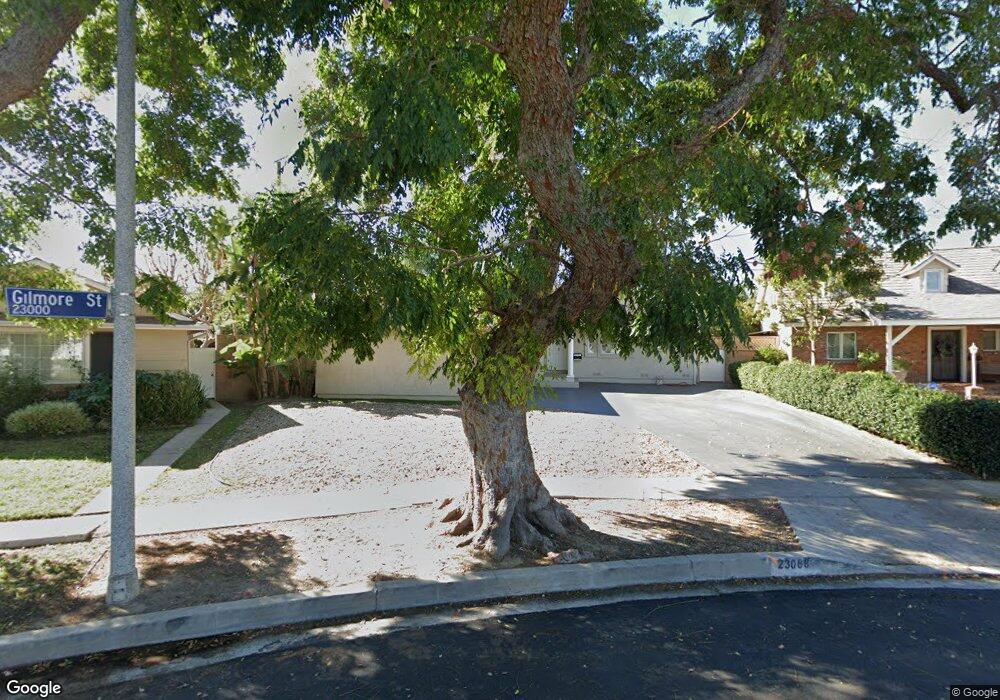
23066 Gilmore St West Hills, CA 91307
Estimated Value: $1,017,486 - $1,108,000
4
Beds
2
Baths
1,744
Sq Ft
$613/Sq Ft
Est. Value
About This Home
This home is located at 23066 Gilmore St, West Hills, CA 91307 and is currently estimated at $1,068,622, approximately $612 per square foot. 23066 Gilmore St is a home located in Los Angeles County with nearby schools including Woodlake Elementary Community Charter, Hamlin Charter Academy, and Lockhurst Drive Charter Elementary.
Ownership History
Date
Name
Owned For
Owner Type
Purchase Details
Closed on
Sep 5, 2019
Sold by
Mottahedeh Kamran
Bought by
Kamran Mottahedeh Trust
Current Estimated Value
Purchase Details
Closed on
Nov 30, 1995
Sold by
Gewock Brandee
Bought by
Mottahedeh Mehran
Home Financials for this Owner
Home Financials are based on the most recent Mortgage that was taken out on this home.
Original Mortgage
$139,500
Interest Rate
6.75%
Purchase Details
Closed on
Oct 27, 1995
Sold by
Mottahedeh Mehran
Bought by
Mottahedeh Karman
Home Financials for this Owner
Home Financials are based on the most recent Mortgage that was taken out on this home.
Original Mortgage
$139,500
Interest Rate
6.75%
Purchase Details
Closed on
Jul 2, 1995
Sold by
Mottahedeh Mehran
Bought by
Gewock Brandee
Create a Home Valuation Report for This Property
The Home Valuation Report is an in-depth analysis detailing your home's value as well as a comparison with similar homes in the area
Home Values in the Area
Average Home Value in this Area
Purchase History
| Date | Buyer | Sale Price | Title Company |
|---|---|---|---|
| Kamran Mottahedeh Trust | -- | None Available | |
| Mottahedeh Mehran | -- | Southland Title | |
| Mottahedeh Karman | $186,000 | Southland Title | |
| Gewock Brandee | -- | -- |
Source: Public Records
Mortgage History
| Date | Status | Borrower | Loan Amount |
|---|---|---|---|
| Previous Owner | Mottahedeh Karman | $139,500 |
Source: Public Records
Tax History Compared to Growth
Tax History
| Year | Tax Paid | Tax Assessment Tax Assessment Total Assessment is a certain percentage of the fair market value that is determined by local assessors to be the total taxable value of land and additions on the property. | Land | Improvement |
|---|---|---|---|---|
| 2025 | $3,974 | $300,664 | $119,596 | $181,068 |
| 2024 | $3,974 | $294,769 | $117,251 | $177,518 |
| 2023 | $3,904 | $288,990 | $114,952 | $174,038 |
| 2022 | $3,734 | $283,325 | $112,699 | $170,626 |
| 2021 | $3,683 | $277,771 | $110,490 | $167,281 |
| 2020 | $3,714 | $274,924 | $109,358 | $165,566 |
| 2019 | $3,580 | $269,534 | $107,214 | $162,320 |
| 2018 | $3,455 | $264,250 | $105,112 | $159,138 |
| 2016 | $3,292 | $253,990 | $101,031 | $152,959 |
| 2015 | $3,247 | $250,176 | $99,514 | $150,662 |
| 2014 | $3,268 | $245,276 | $97,565 | $147,711 |
Source: Public Records
Map
Nearby Homes
- 23026 Mobile St
- 23036 Victory Blvd
- 23238 Victory Blvd
- 6201 Melba Ave
- 6667 Royer Ave
- 23432 Victory Blvd
- 22835 Styles St
- 6243 Fallbrook Ave
- 23232 Hartland St
- 6227 Glide Ave
- 6814 Berquist Ave
- 22851 Calvert St
- 23123 Oxnard St
- 23549 Victory Blvd Unit 21
- 23201 Oxnard St
- 22642 Victory Blvd
- 6172 Dalecrest Ave
- 23130 Oxnard St
- 22630 Gilmore St
- 23320 Bassett St
- 6431 Dannyboyar Ave
- 23060 Gilmore St
- 23119 Victory Blvd
- 23111 Victory Blvd
- 6437 Dannyboyar Ave
- 23054 Gilmore St
- 6418 Woodlake Ave
- 6424 Woodlake Ave
- 23127 Victory Blvd
- 6430 Woodlake Ave
- 23105 Victory Blvd
- 23055 Gilmore St
- 6443 Dannyboyar Ave
- 23048 Gilmore St
- 6436 Woodlake Ave
- 23133 Victory Blvd
- 23101 Victory Blvd
- 23049 Gilmore St
- 6442 Woodlake Ave
- 6449 Dannyboyar Ave