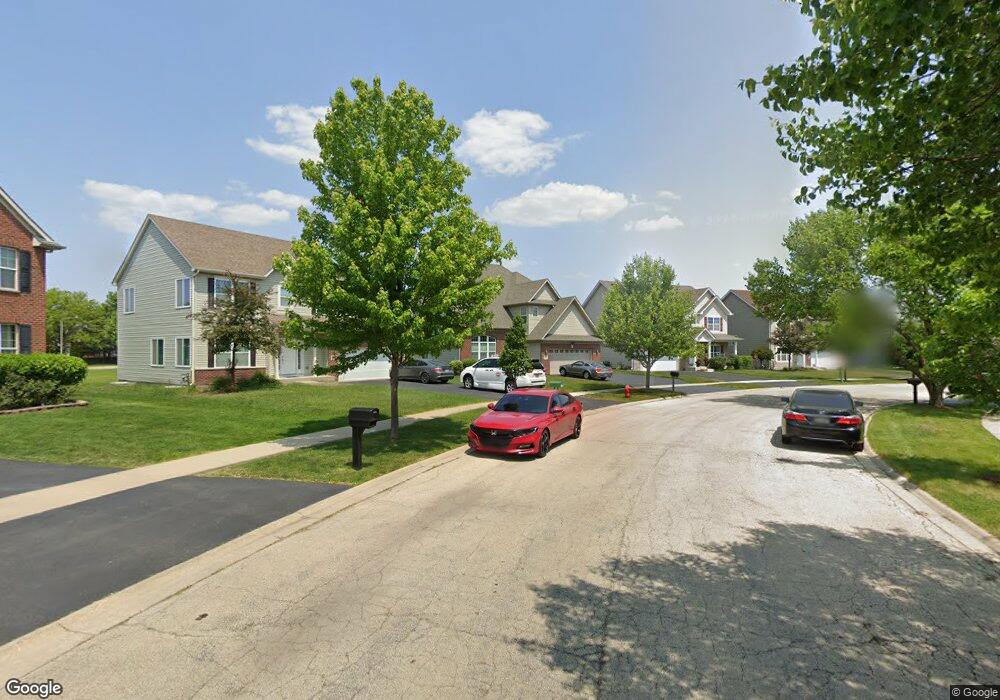
2307 Covington Ct Unit 1 Plainfield, IL 60586
North Minooka NeighborhoodEstimated Value: $436,713 - $481,000
4
Beds
3
Baths
2,900
Sq Ft
$157/Sq Ft
Est. Value
About This Home
This home is located at 2307 Covington Ct Unit 1, Plainfield, IL 60586 and is currently estimated at $456,178, approximately $157 per square foot. 2307 Covington Ct Unit 1 is a home located in Kendall County with nearby schools including Charles Reed Elementary School, Aux Sable Middle School, and Plainfield South High School.
Ownership History
Date
Name
Owned For
Owner Type
Purchase Details
Closed on
Mar 11, 2011
Sold by
Club I Llc
Bought by
Sossong Eric J and Sessoms April L
Current Estimated Value
Home Financials for this Owner
Home Financials are based on the most recent Mortgage that was taken out on this home.
Original Mortgage
$273,903
Outstanding Balance
$192,224
Interest Rate
5.25%
Mortgage Type
FHA
Estimated Equity
$263,954
Purchase Details
Closed on
Jan 29, 2010
Sold by
Guaranty Plus Properties Inc I
Bought by
Club I Llc
Purchase Details
Closed on
Nov 28, 2008
Sold by
Neumann Homes Inc
Bought by
Guaranty Plus Properties Inc I
Create a Home Valuation Report for This Property
The Home Valuation Report is an in-depth analysis detailing your home's value as well as a comparison with similar homes in the area
Home Values in the Area
Average Home Value in this Area
Purchase History
| Date | Buyer | Sale Price | Title Company |
|---|---|---|---|
| Sossong Eric J | $281,500 | First American Title | |
| Club I Llc | $550,000 | Chicago Title Insurance Co | |
| Guaranty Plus Properties Inc I | -- | First American Title Ins Co |
Source: Public Records
Mortgage History
| Date | Status | Borrower | Loan Amount |
|---|---|---|---|
| Open | Sossong Eric J | $273,903 |
Source: Public Records
Tax History
| Year | Tax Paid | Tax Assessment Tax Assessment Total Assessment is a certain percentage of the fair market value that is determined by local assessors to be the total taxable value of land and additions on the property. | Land | Improvement |
|---|---|---|---|---|
| 2024 | $8,802 | $127,715 | $15,449 | $112,266 |
| 2023 | $7,610 | $115,979 | $13,434 | $102,545 |
| 2022 | $7,610 | $101,559 | $13,133 | $88,426 |
| 2021 | $7,541 | $98,651 | $13,111 | $85,540 |
| 2020 | $6,236 | $81,192 | $13,027 | $68,165 |
| 2019 | $6,343 | $81,192 | $13,027 | $68,165 |
| 2018 | $6,514 | $81,192 | $13,027 | $68,165 |
| 2017 | $6,508 | $78,207 | $13,027 | $65,180 |
| 2016 | $6,205 | $73,204 | $12,866 | $60,338 |
| 2015 | $6,462 | $72,548 | $12,210 | $60,338 |
| 2014 | -- | $70,105 | $12,210 | $57,895 |
| 2013 | -- | $70,105 | $12,210 | $57,895 |
Source: Public Records
Map
Nearby Homes
- 2302 Covington Ct
- 2224 Ashby Ln
- 2199 Ashby Ln Unit 2
- 2155 Henning Place
- 7514 Rosewind Dr Unit 2
- 2126 Ingersoll Ct
- 2009 Ashbrook Ct Unit 3
- 2404 White Ash Ct
- 1918 Windstone Dr
- 2401 Red Oak Ct
- 2017 Lilyana Ln
- 1910 Crestview Dr Unit 2
- 2745 Canyon Dr Unit 94
- 2417 Millpond Ct Unit 4
- 17245 County Line Rd
- 2508 Falls Ct
- 1702 Waterman Dr
- 2707 Cedar Breaks Ct Unit 9
- 2604 Discovery Dr
- 1811 Cumberland Dr
- 2309 Covington Ct
- 2305 Covington Ct
- 2311 Covington Ct
- 2303 Covington Ct Unit 1
- 2313 Covington Ct
- 2301 Covington Ct
- 2304 Covington Ct
- 2315 Covington Ct
- 2306 Covington Ct
- 7309 Ashbrook Ln
- 2226 Ashby Ln Unit 1
- 2228 Ashby Ln Unit 1
- 2317 Covington Ct
- 2308 Covington Ct
- 2222 Ashby Ln Unit 1
- 2300 Ashby Ln Unit 1
- 7307 Ashbrook Ln
- 2220 Ashby Ln Unit 1
- 2302 Ashby Ln Unit 1
- 2319 Covington Ct
Your Personal Tour Guide
Ask me questions while you tour the home.