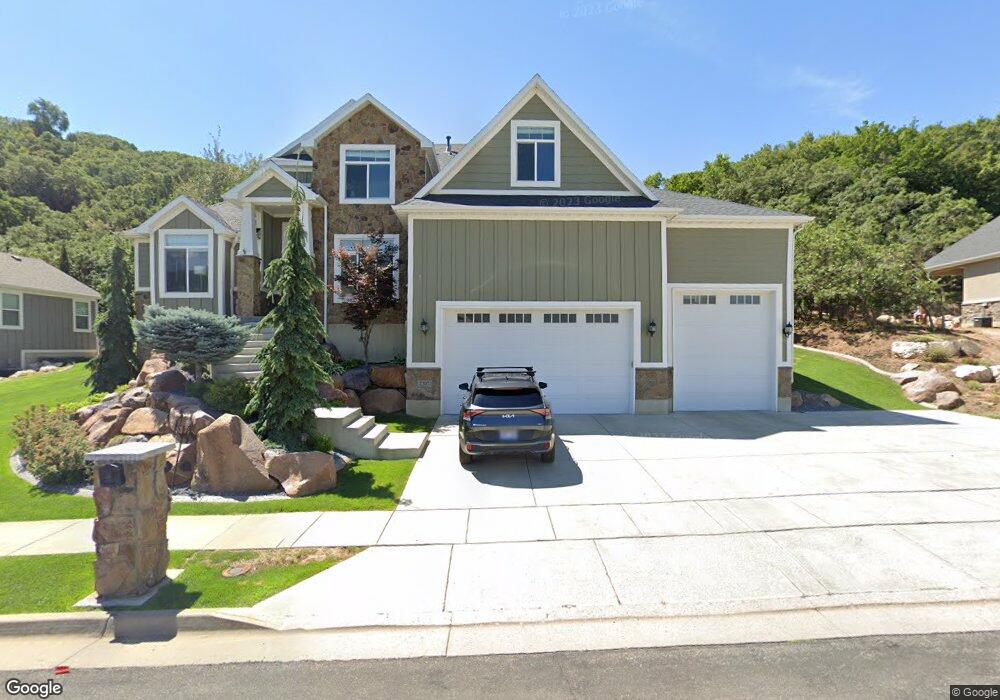
2307 E 8300 S South Weber, UT 84405
Estimated Value: $895,000 - $1,386,000
5
Beds
3
Baths
4,625
Sq Ft
$230/Sq Ft
Est. Value
About This Home
This home is located at 2307 E 8300 S, South Weber, UT 84405 and is currently estimated at $1,062,716, approximately $229 per square foot. 2307 E 8300 S is a home located in Davis County with nearby schools including South Weber Elementary School, Sunset Junior High School, and Northridge High School.
Ownership History
Date
Name
Owned For
Owner Type
Purchase Details
Closed on
Jun 25, 2019
Sold by
Bosley Lori and Bosley Ryan
Bought by
Bosley Ryan and Bosley Lori
Current Estimated Value
Home Financials for this Owner
Home Financials are based on the most recent Mortgage that was taken out on this home.
Original Mortgage
$481,000
Outstanding Balance
$314,769
Interest Rate
4%
Mortgage Type
New Conventional
Estimated Equity
$747,947
Purchase Details
Closed on
Oct 3, 2014
Sold by
Bosley Lori and Bosley Ryan
Bought by
The Lori Lee Bosley Living Trust and Bosley Ryan
Purchase Details
Closed on
Jan 17, 2013
Sold by
Nilson And Company Inc
Bought by
Bosley Ryan and Bosley Lori
Home Financials for this Owner
Home Financials are based on the most recent Mortgage that was taken out on this home.
Original Mortgage
$231,650
Interest Rate
3.31%
Mortgage Type
Construction
Create a Home Valuation Report for This Property
The Home Valuation Report is an in-depth analysis detailing your home's value as well as a comparison with similar homes in the area
Home Values in the Area
Average Home Value in this Area
Purchase History
| Date | Buyer | Sale Price | Title Company |
|---|---|---|---|
| Bosley Ryan | -- | Mountain View Title | |
| The Lori Lee Bosley Living Trust | -- | None Available | |
| Bosley Ryan | -- | Bonneville Superior Title Co |
Source: Public Records
Mortgage History
| Date | Status | Borrower | Loan Amount |
|---|---|---|---|
| Open | Bosley Ryan | $481,000 | |
| Closed | Bosley Ryan | $231,650 |
Source: Public Records
Tax History Compared to Growth
Tax History
| Year | Tax Paid | Tax Assessment Tax Assessment Total Assessment is a certain percentage of the fair market value that is determined by local assessors to be the total taxable value of land and additions on the property. | Land | Improvement |
|---|---|---|---|---|
| 2025 | $5,079 | $471,900 | $101,248 | $370,652 |
| 2024 | $4,795 | $455,400 | $83,995 | $371,405 |
| 2023 | $4,500 | $775,000 | $135,264 | $639,736 |
| 2022 | $5,043 | $482,900 | $72,625 | $410,275 |
| 2021 | $4,984 | $730,000 | $106,044 | $623,956 |
| 2020 | $4,552 | $648,000 | $97,834 | $550,166 |
| 2019 | $4,635 | $648,000 | $91,113 | $556,887 |
| 2018 | $4,148 | $607,000 | $82,390 | $524,610 |
| 2016 | $3,916 | $302,555 | $35,933 | $266,622 |
| 2015 | $3,857 | $282,810 | $35,933 | $246,877 |
| 2014 | -- | $250,206 | $41,302 | $208,904 |
| 2013 | -- | $61,664 | $61,664 | $0 |
Source: Public Records
Map
Nearby Homes
- 2368 E 8300 S
- 2256 E 8240 S
- 3785 N 2675 E
- 8149 S 2425 E
- 3680 N 2300 E
- 3624 N 2775 E
- 3606 N 2775 E
- 2681 E Sunshine Ct
- 2277 E 3225 N
- 2002 Deer Run Dr
- 2255 E 3225 N
- 3302 N 2175 E
- 303 S 2700 E
- 305 S 2700 E Unit 305
- 3532 N Layton Ridge Dr
- 2008 E Redtail Way
- 1962 E 7550 S
- 1935 Deere Valley Dr
- 1911 Deere Valley Dr
- 2777 E 2700 N