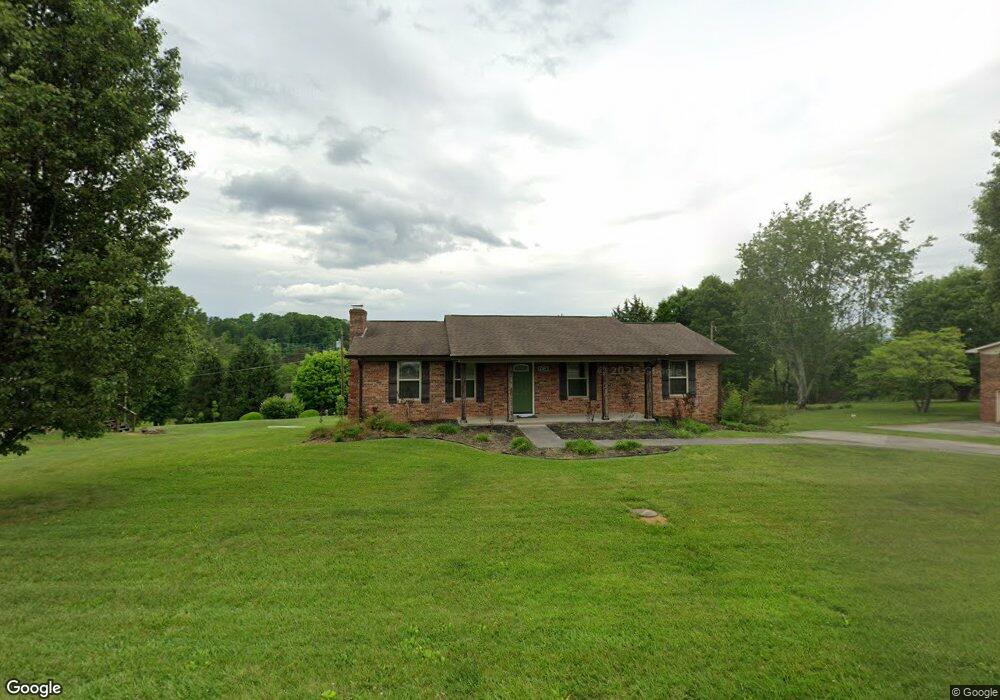
2307 Fern Cir Morristown, TN 37814
Estimated Value: $296,000 - $364,000
3
Beds
2
Baths
1,323
Sq Ft
$243/Sq Ft
Est. Value
About This Home
This home is located at 2307 Fern Cir, Morristown, TN 37814 and is currently estimated at $321,488, approximately $242 per square foot. 2307 Fern Cir is a home located in Hamblen County with nearby schools including Russellville Elementary School, East Ridge Middle School, and Morristown East High School.
Ownership History
Date
Name
Owned For
Owner Type
Purchase Details
Closed on
Nov 20, 2020
Sold by
Harrell Tracy and Keaton Tammy
Bought by
Young Joshua P and Young Catherine L
Current Estimated Value
Home Financials for this Owner
Home Financials are based on the most recent Mortgage that was taken out on this home.
Original Mortgage
$199,405
Outstanding Balance
$177,442
Interest Rate
2.8%
Mortgage Type
New Conventional
Estimated Equity
$144,046
Purchase Details
Closed on
Jul 2, 2020
Sold by
Ridley Gary and Ridley Lisa
Bought by
Harrell Tracy and Keaton Tammy
Purchase Details
Closed on
Feb 27, 1998
Sold by
Jo Evans Bobbie
Bought by
Gary Ridley
Purchase Details
Closed on
Feb 16, 1990
Bought by
Evans Bobbie Jo
Purchase Details
Closed on
Apr 28, 1977
Bought by
Evans Duane Q and Evans Bobbie
Create a Home Valuation Report for This Property
The Home Valuation Report is an in-depth analysis detailing your home's value as well as a comparison with similar homes in the area
Home Values in the Area
Average Home Value in this Area
Purchase History
| Date | Buyer | Sale Price | Title Company |
|---|---|---|---|
| Young Joshua P | $209,900 | None Available | |
| Young Joshua P | $209,900 | None Listed On Document | |
| Harrell Tracy | -- | Lakeway Title Services | |
| Gary Ridley | $69,900 | -- | |
| Evans Bobbie Jo | -- | -- | |
| Evans Duane Q | $29,900 | -- |
Source: Public Records
Mortgage History
| Date | Status | Borrower | Loan Amount |
|---|---|---|---|
| Open | Young Joshua P | $199,405 | |
| Closed | Young Joshua P | $199,405 |
Source: Public Records
Tax History Compared to Growth
Tax History
| Year | Tax Paid | Tax Assessment Tax Assessment Total Assessment is a certain percentage of the fair market value that is determined by local assessors to be the total taxable value of land and additions on the property. | Land | Improvement |
|---|---|---|---|---|
| 2024 | $730 | $37,075 | $4,475 | $32,600 |
| 2023 | $730 | $37,075 | $0 | $0 |
| 2022 | $730 | $37,075 | $4,475 | $32,600 |
| 2021 | $730 | $37,075 | $4,475 | $32,600 |
| 2020 | $595 | $37,075 | $4,475 | $32,600 |
| 2019 | $529 | $24,825 | $4,650 | $20,175 |
| 2018 | $529 | $24,825 | $4,650 | $20,175 |
| 2017 | $529 | $24,825 | $4,650 | $20,175 |
| 2016 | $494 | $24,825 | $4,650 | $20,175 |
| 2015 | $459 | $24,825 | $4,650 | $20,175 |
| 2014 | -- | $24,825 | $4,650 | $20,175 |
| 2013 | -- | $28,125 | $0 | $0 |
Source: Public Records
Map
Nearby Homes
- 5110 Anne Cir
- 4959 Brights Pike
- 3800 Dan Dr
- 2551 Cedar Creek Rd
- 4475 Copeland Dr
- 4119 Azalea Ct
- 4547 Brights Pike
- 5556 Denton Dr
- 4146 Leslie Dr
- Lot 17 Waters Edge Dr
- 3835 High Oak Dr
- 1708 Boardwalk Cir
- 4801 Harbor Dr
- 5601 Brights Pike
- 5659 Browning Way
- 4110 Harbor View Dr
- 5085 Old Kentucky Rd
- 4086 Harbor View Dr