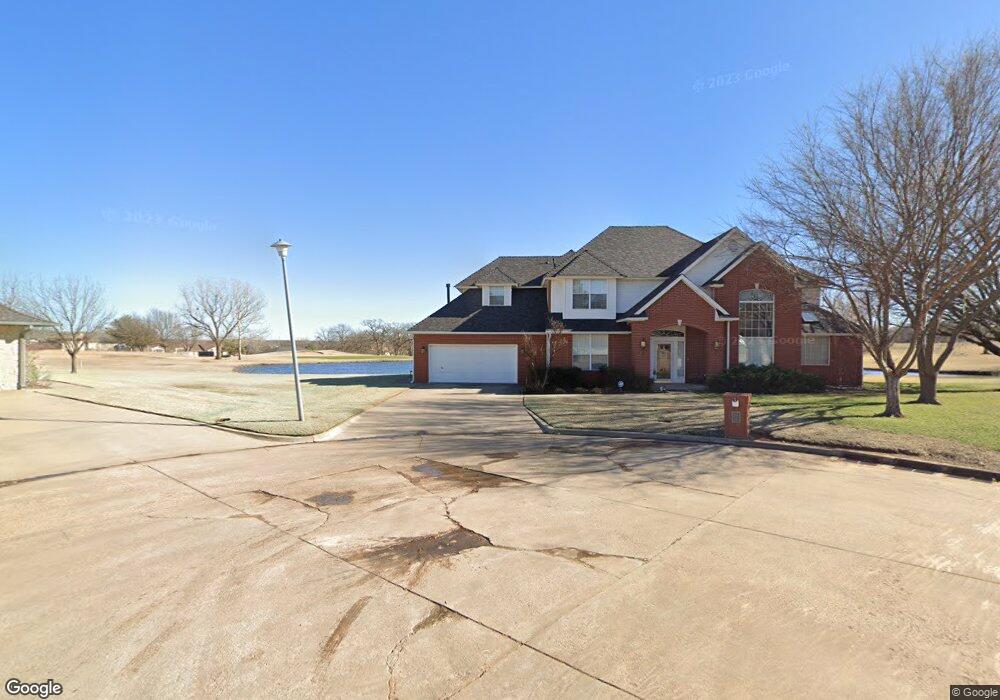
2307 Lakeside Cir Shawnee, OK 74801
Estimated Value: $390,075 - $433,000
4
Beds
3
Baths
3,204
Sq Ft
$131/Sq Ft
Est. Value
About This Home
This home is located at 2307 Lakeside Cir, Shawnee, OK 74801 and is currently estimated at $418,519, approximately $130 per square foot. 2307 Lakeside Cir is a home located in Pottawatomie County with nearby schools including Pleasant Grove Public School.
Ownership History
Date
Name
Owned For
Owner Type
Purchase Details
Closed on
Mar 21, 2005
Sold by
Pfaff Miohallf and Pfaff Frank M
Bought by
Pfaff Frank M and Palladino Judith Anne
Current Estimated Value
Purchase Details
Closed on
Mar 24, 1998
Sold by
Scott Jerry and Scott Rita
Bought by
Pfaff Michael and Pfaff Bonnie
Purchase Details
Closed on
Sep 13, 1996
Sold by
Schmierer Dan and Schmierer Linda
Bought by
Scott Jerry
Purchase Details
Closed on
Dec 1, 1993
Sold by
Finley Cleaners Inc
Bought by
Schmierer Dan and Schmierer Linda
Purchase Details
Closed on
Apr 27, 1993
Sold by
Finley Cleaners Inc
Create a Home Valuation Report for This Property
The Home Valuation Report is an in-depth analysis detailing your home's value as well as a comparison with similar homes in the area
Home Values in the Area
Average Home Value in this Area
Purchase History
| Date | Buyer | Sale Price | Title Company |
|---|---|---|---|
| Pfaff Frank M | -- | None Available | |
| Pfaff Michael | $245,000 | -- | |
| Scott Jerry | $23,500 | -- | |
| Schmierer Dan | $52,000 | -- | |
| -- | -- | -- |
Source: Public Records
Tax History Compared to Growth
Tax History
| Year | Tax Paid | Tax Assessment Tax Assessment Total Assessment is a certain percentage of the fair market value that is determined by local assessors to be the total taxable value of land and additions on the property. | Land | Improvement |
|---|---|---|---|---|
| 2024 | $2,883 | $35,263 | $3,600 | $31,663 |
| 2023 | $2,883 | $33,584 | $3,600 | $29,984 |
| 2022 | $2,912 | $33,584 | $3,600 | $29,984 |
| 2021 | $2,921 | $33,503 | $3,600 | $29,903 |
| 2020 | $2,975 | $33,885 | $3,600 | $30,285 |
| 2019 | $2,995 | $34,268 | $3,600 | $30,668 |
| 2018 | $2,724 | $34,682 | $3,525 | $31,157 |
| 2017 | $2,595 | $33,030 | $3,321 | $29,709 |
| 2016 | $2,471 | $31,458 | $3,097 | $28,361 |
| 2015 | $2,688 | $29,959 | $3,082 | $26,877 |
| 2014 | $2,560 | $28,533 | $4,320 | $24,213 |
Source: Public Records
Map
Nearby Homes
- 9 Country Club Rd
- 0 Robinwood Place
- 2500 E Highland St
- 1 Country Club Rd
- 1824 E Remington St
- 607 Pool Place
- 601 Pool Ln
- 703 N Roosevelt Ave
- 711 N Cleveland Ave
- 301 Clubhouse Dr
- 1181 Augusta Ct
- 1262 Augusta Ct
- 2400 Augusta
- 1253 Augusta Ct
- 648 N Cleveland Ave
- 1213 Muirfield Dr
- 210 N Roosevelt Ave
- 42 Mojave Dr
- 29 Dakota Dr
- 2309 Pinehurst Ct
- 2305 Lakeside Cir
- 2312 Lakeside Cir
- 2310 Lakeside Cir
- 2303 Lakeside Cir
- 2308 Lakeside Cir
- 2306 Lakeside Cir
- 505 Lakeside Ct
- 503 Lakeside Ct
- 2304 Lakeside Cir
- 501 Lakeside Ct
- 10 Country Club Rd
- 542 Lakeside Ct
- 540 Lakeside Ct
- 538 Lakeside Ct
- 2302 Lakeside Cir
- 2405 Robinwood Place
- 2407 Robinwood Place
- 2311 Robinwood Cir
- 536 Lakeside Ct
- 6 Country Club Rd