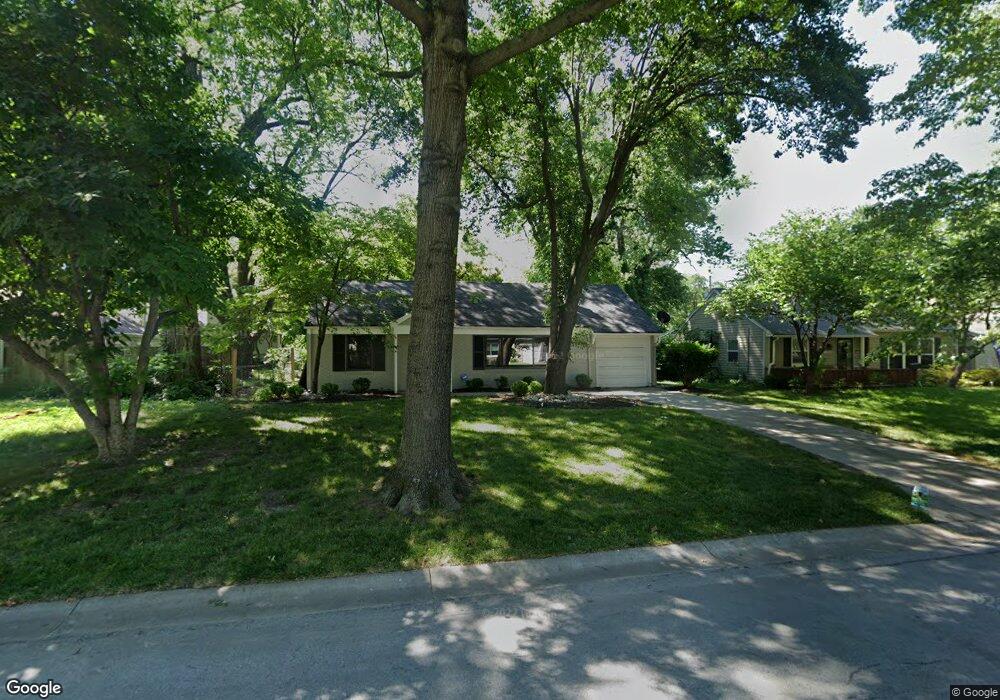
2307 W 76th St Prairie Village, KS 66208
Estimated Value: $299,000 - $321,000
2
Beds
1
Bath
955
Sq Ft
$322/Sq Ft
Est. Value
About This Home
This home is located at 2307 W 76th St, Prairie Village, KS 66208 and is currently estimated at $307,769, approximately $322 per square foot. 2307 W 76th St is a home located in Johnson County with nearby schools including Belinder Elementary School, Indian Hills Middle School, and Shawnee Mission East High School.
Ownership History
Date
Name
Owned For
Owner Type
Purchase Details
Closed on
May 28, 2025
Sold by
Sanson John R and Sanson Jane E
Bought by
Sanson Properties Llc
Current Estimated Value
Purchase Details
Closed on
Feb 20, 2020
Sold by
Theros Ryan and Theros Lindsey
Bought by
Sanson Jane E and Sanson John R
Purchase Details
Closed on
Dec 16, 2004
Sold by
Jpmorgan Chase Bank
Bought by
Sanson Lindsey N
Home Financials for this Owner
Home Financials are based on the most recent Mortgage that was taken out on this home.
Original Mortgage
$84,975
Interest Rate
5.25%
Mortgage Type
Adjustable Rate Mortgage/ARM
Purchase Details
Closed on
Dec 20, 2001
Sold by
Perkins Jason Allan and Perkins Lindsay A
Bought by
Perkins Jason A and Perkins Lindsay A
Home Financials for this Owner
Home Financials are based on the most recent Mortgage that was taken out on this home.
Original Mortgage
$91,574
Interest Rate
6.73%
Mortgage Type
FHA
Create a Home Valuation Report for This Property
The Home Valuation Report is an in-depth analysis detailing your home's value as well as a comparison with similar homes in the area
Home Values in the Area
Average Home Value in this Area
Purchase History
| Date | Buyer | Sale Price | Title Company |
|---|---|---|---|
| Sanson Properties Llc | -- | None Listed On Document | |
| Sanson Properties Llc | -- | None Listed On Document | |
| Sanson Jane E | -- | None Available | |
| Sanson Lindsey N | -- | Kansas Title Ins Corp | |
| Perkins Jason A | -- | Kansas Title |
Source: Public Records
Mortgage History
| Date | Status | Borrower | Loan Amount |
|---|---|---|---|
| Previous Owner | Sanson Lindsey N | $84,975 | |
| Previous Owner | Perkins Jason A | $91,574 |
Source: Public Records
Tax History Compared to Growth
Tax History
| Year | Tax Paid | Tax Assessment Tax Assessment Total Assessment is a certain percentage of the fair market value that is determined by local assessors to be the total taxable value of land and additions on the property. | Land | Improvement |
|---|---|---|---|---|
| 2024 | $3,512 | $29,739 | $14,507 | $15,232 |
| 2023 | $3,609 | $30,027 | $13,821 | $16,206 |
| 2022 | $3,290 | $27,221 | $12,019 | $15,202 |
| 2021 | $2,990 | $23,276 | $10,925 | $12,351 |
| 2020 | $2,479 | $18,791 | $9,936 | $8,855 |
| 2019 | $2,442 | $18,320 | $8,280 | $10,040 |
| 2018 | $2,051 | $15,180 | $7,197 | $7,983 |
| 2017 | $1,972 | $14,433 | $6,000 | $8,433 |
| 2016 | $1,938 | $13,961 | $4,801 | $9,160 |
| 2015 | $1,902 | $13,915 | $4,801 | $9,114 |
| 2013 | -- | $13,823 | $4,572 | $9,251 |
Source: Public Records
Map
Nearby Homes
- 2400 W 77th St
- 7652 Rainbow Dr
- 2318 W 79th St
- 2624 W 75th Place
- 7615 Terrace St
- 2207 W 79th Terrace
- 7437 Belinder Ave
- 2606 W 79th Terrace
- 7328 Booth St
- 7700 Norwood St
- 1127 W 76th Terrace
- 7444 Cherokee Dr
- 2004 W 72nd Terrace
- 1296 W 72nd Terrace
- 7216 Booth St
- 8005 Ensley Ln
- 7740 Chadwick St
- 7416 Belleview Ave
- 8025 High Dr
- 8020 Meadow Ln