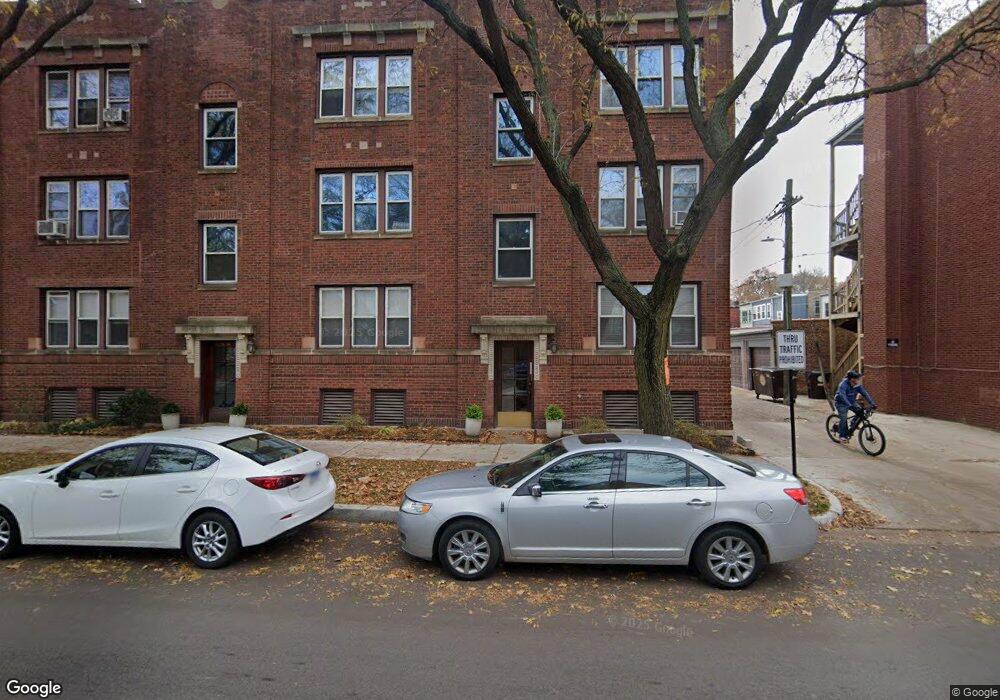
2307 W Ainslie St Unit 1 Chicago, IL 60625
Lincoln Square NeighborhoodEstimated Value: $238,934 - $312,000
1
Bed
1
Bath
900
Sq Ft
$307/Sq Ft
Est. Value
About This Home
This home is located at 2307 W Ainslie St Unit 1, Chicago, IL 60625 and is currently estimated at $276,734, approximately $307 per square foot. 2307 W Ainslie St Unit 1 is a home located in Cook County with nearby schools including McPherson Elementary School, Amundsen High School, and St. Matthias School.
Ownership History
Date
Name
Owned For
Owner Type
Purchase Details
Closed on
Apr 24, 2017
Sold by
Lau Christine Denise and Wisniewski Christine
Bought by
2307 1 Ainslie Llc
Current Estimated Value
Purchase Details
Closed on
Oct 30, 2003
Sold by
Felber Rachel A
Bought by
Wisniewski Christine
Home Financials for this Owner
Home Financials are based on the most recent Mortgage that was taken out on this home.
Original Mortgage
$151,200
Interest Rate
4.87%
Mortgage Type
Adjustable Rate Mortgage/ARM
Purchase Details
Closed on
May 23, 1998
Sold by
Perencevic Milan and Perencevic Mirjana
Bought by
Felber Rachel A
Home Financials for this Owner
Home Financials are based on the most recent Mortgage that was taken out on this home.
Original Mortgage
$75,940
Interest Rate
6.89%
Mortgage Type
Purchase Money Mortgage
Create a Home Valuation Report for This Property
The Home Valuation Report is an in-depth analysis detailing your home's value as well as a comparison with similar homes in the area
Home Values in the Area
Average Home Value in this Area
Purchase History
| Date | Buyer | Sale Price | Title Company |
|---|---|---|---|
| 2307 1 Ainslie Llc | $162,000 | Chicago Title | |
| Wisniewski Christine | $168,000 | Multiple | |
| Felber Rachel A | $94,000 | -- |
Source: Public Records
Mortgage History
| Date | Status | Borrower | Loan Amount |
|---|---|---|---|
| Previous Owner | Wisniewski Christine | $151,200 | |
| Previous Owner | Felber Rachel A | $75,940 |
Source: Public Records
Tax History Compared to Growth
Tax History
| Year | Tax Paid | Tax Assessment Tax Assessment Total Assessment is a certain percentage of the fair market value that is determined by local assessors to be the total taxable value of land and additions on the property. | Land | Improvement |
|---|---|---|---|---|
| 2024 | $3,928 | $19,814 | $4,649 | $15,165 |
| 2023 | $3,830 | $18,620 | $3,738 | $14,882 |
| 2022 | $3,830 | $18,620 | $3,738 | $14,882 |
| 2021 | $3,744 | $18,619 | $3,738 | $14,881 |
| 2020 | $3,318 | $14,894 | $1,962 | $12,932 |
| 2019 | $3,302 | $16,436 | $1,962 | $14,474 |
| 2018 | $3,247 | $16,436 | $1,962 | $14,474 |
| 2017 | $2,976 | $17,201 | $1,682 | $15,519 |
| 2016 | $2,945 | $17,201 | $1,682 | $15,519 |
| 2015 | $2,671 | $17,201 | $1,682 | $15,519 |
| 2014 | $2,047 | $13,602 | $1,261 | $12,341 |
| 2013 | $1,996 | $13,602 | $1,261 | $12,341 |
Source: Public Records
Map
Nearby Homes
- 5011 N Western Ave
- 4700 N Western Ave Unit 4B
- 2224 W Eastwood Ave
- 5058 N Claremont Ave Unit 2E
- 2455 W Leland Ave Unit 1
- 2135 W Leland Ave
- 2201 W Winona St Unit 2201G
- 2307 W Foster Ave Unit 1
- 2307 W Foster Ave Unit 3
- 2307 W Foster Ave Unit 2
- 4519 N Western Ave
- 4755 N Washtenaw Ave Unit P-27
- 4755 N Washtenaw Ave Unit P-11
- 4755 N Washtenaw Ave Unit P-25
- 2416 W Foster Ave Unit 2S
- 2150 W Foster Ave Unit 2
- 2709 W Lawrence Ave Unit 3
- 5015 N Damen Ave
- 4906 N Winchester Ave
- 4726 N Winchester Ave Unit F
- 2309 W Ainslie St Unit 23092
- 2309 W Ainslie St Unit 3
- 2309 W Ainslie St Unit 2
- 2307 W Ainslie St
- 2307 W Ainslie St Unit 2
- 2311 W Ainslie St Unit 2
- 2311 W Ainslie St Unit 1
- 4856 N Oakley Ave Unit 2
- 4856 N Oakley Ave Unit 1
- 4854 N Oakley Ave Unit 23112
- 4854 N Oakley Ave Unit 23093
- 4854 N Oakley Ave Unit 48561
- 4854 N Oakley Ave Unit 48543
- 4854 N Oakley Ave Unit 23072
- 4854 N Oakley Ave Unit 23073
- 4854 N Oakley Ave Unit 23091
- 4854 N Oakley Ave Unit 48542
- 4854 N Oakley Ave Unit 48562
- 4854 N Oakley Ave Unit 23071
- 4854 N Oakley Ave Unit 48541