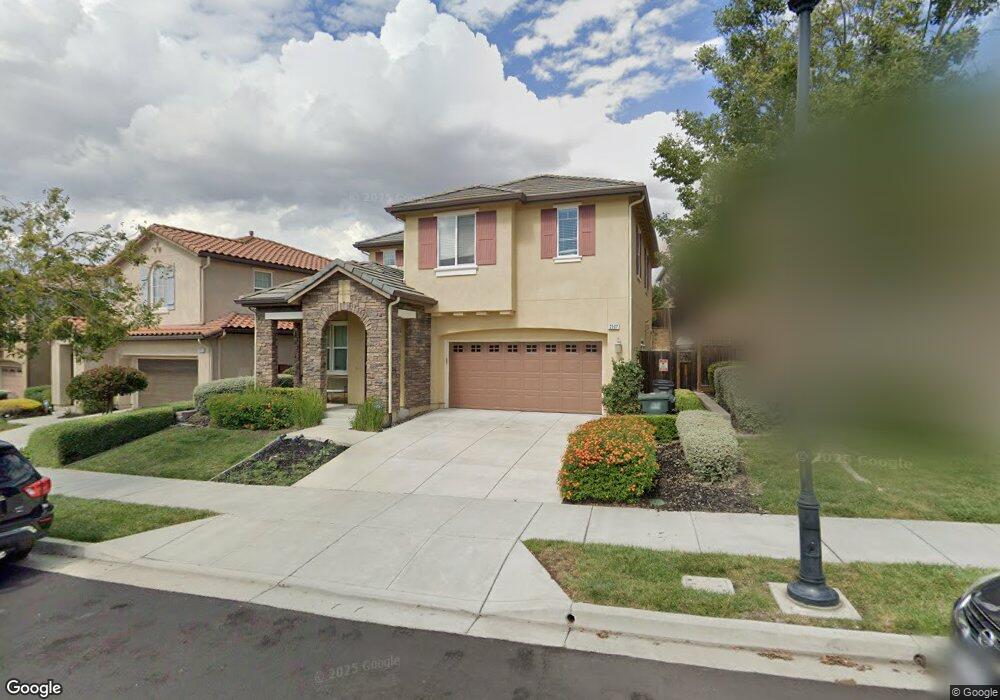
2307 W Cantara Dr Dublin, CA 94568
Positano NeighborhoodEstimated Value: $1,703,000 - $1,929,000
4
Beds
3
Baths
2,336
Sq Ft
$774/Sq Ft
Est. Value
About This Home
This home is located at 2307 W Cantara Dr, Dublin, CA 94568 and is currently estimated at $1,807,546, approximately $773 per square foot. 2307 W Cantara Dr is a home located in Alameda County with nearby schools including J.M. Amador Elementary School, Dublin High School, and SPRINGFIELD MONTESSORI SCHOOL.
Ownership History
Date
Name
Owned For
Owner Type
Purchase Details
Closed on
Dec 13, 2015
Sold by
Chang Kenneth C W and Li Shannon S
Bought by
The Chang & Li Family Trust
Current Estimated Value
Purchase Details
Closed on
Jul 24, 2015
Sold by
He Xiaodong and Zhao Jie
Bought by
Chang Kenneth C and Li Shannon S
Home Financials for this Owner
Home Financials are based on the most recent Mortgage that was taken out on this home.
Original Mortgage
$788,000
Outstanding Balance
$617,001
Interest Rate
3.98%
Mortgage Type
New Conventional
Estimated Equity
$1,190,545
Purchase Details
Closed on
Aug 4, 2010
Sold by
Kb Home South Bay Inc
Bought by
He Xiaodong and Zhao Jie
Home Financials for this Owner
Home Financials are based on the most recent Mortgage that was taken out on this home.
Original Mortgage
$524,448
Interest Rate
4.51%
Mortgage Type
New Conventional
Create a Home Valuation Report for This Property
The Home Valuation Report is an in-depth analysis detailing your home's value as well as a comparison with similar homes in the area
Home Values in the Area
Average Home Value in this Area
Purchase History
| Date | Buyer | Sale Price | Title Company |
|---|---|---|---|
| The Chang & Li Family Trust | -- | None Available | |
| Chang Kenneth C | $1,025,000 | Old Republic Title Company | |
| He Xiaodong | $656,000 | First American Title Company |
Source: Public Records
Mortgage History
| Date | Status | Borrower | Loan Amount |
|---|---|---|---|
| Open | Chang Kenneth C | $788,000 | |
| Previous Owner | He Xiaodong | $524,448 |
Source: Public Records
Tax History
| Year | Tax Paid | Tax Assessment Tax Assessment Total Assessment is a certain percentage of the fair market value that is determined by local assessors to be the total taxable value of land and additions on the property. | Land | Improvement |
|---|---|---|---|---|
| 2025 | $16,282 | $1,206,363 | $364,009 | $849,354 |
| 2024 | $16,282 | $1,182,573 | $356,872 | $832,701 |
| 2023 | $16,574 | $1,166,254 | $349,876 | $816,378 |
| 2022 | $16,361 | $1,136,387 | $343,016 | $800,371 |
| 2021 | $16,179 | $1,113,970 | $336,291 | $784,679 |
| 2020 | $15,165 | $1,109,480 | $332,844 | $776,636 |
| 2019 | $15,163 | $1,087,730 | $326,319 | $761,411 |
| 2018 | $14,805 | $1,066,410 | $319,923 | $746,487 |
| 2017 | $14,596 | $1,045,500 | $313,650 | $731,850 |
| 2016 | $13,342 | $1,025,000 | $307,500 | $717,500 |
| 2015 | $9,407 | $698,762 | $209,682 | $489,080 |
| 2014 | $9,402 | $685,076 | $205,575 | $479,501 |
Source: Public Records
Map
Nearby Homes
- 4999 Piper Glen Terrace
- 5271 Salerno Dr
- 3956 Jordan Ranch Dr
- 4371 Panorama Dr
- 1937 Whitney Ave
- 1935 Ingalls Way
- 1691 S Wren St
- 2008 Confidence Way
- 1949 Michael Ave
- 2239 Central Pkwy
- 1913 Michael Ave
- 1901 Michael Ave
- 2100 Carbondale Cir
- 1683 S Wren St
- 2206 Central Pkwy
- 1705 Central Pkwy
- 4152 Kevin St
- 4156 Kevin St
- 2848 E Cog Hill Terrace
- 1658 Wren St
- 2301 W Cantara Dr
- 2313 W Cantara Dr
- 2319 W Cantara Dr
- 2326 Amatrice Way
- 2312 Amatrice Way
- 4804 Valerio St
- 4800 Valerio St
- 2340 Amatrice Way
- 2325 W Cantara Dr
- 2300 Amatrice Way
- 2308 W Cantara Dr
- 2302 W Cantara Dr
- 2352 Amatrice Way
- 2298 W Cantara Dr
- 2316 W Cantara Dr
- 2331 W Cantara Dr
- 2292 W Cantara Dr
- 2320 W Cantara Dr
- 4837 La Vina St
- 2360 Amatrice Way
Your Personal Tour Guide
Ask me questions while you tour the home.