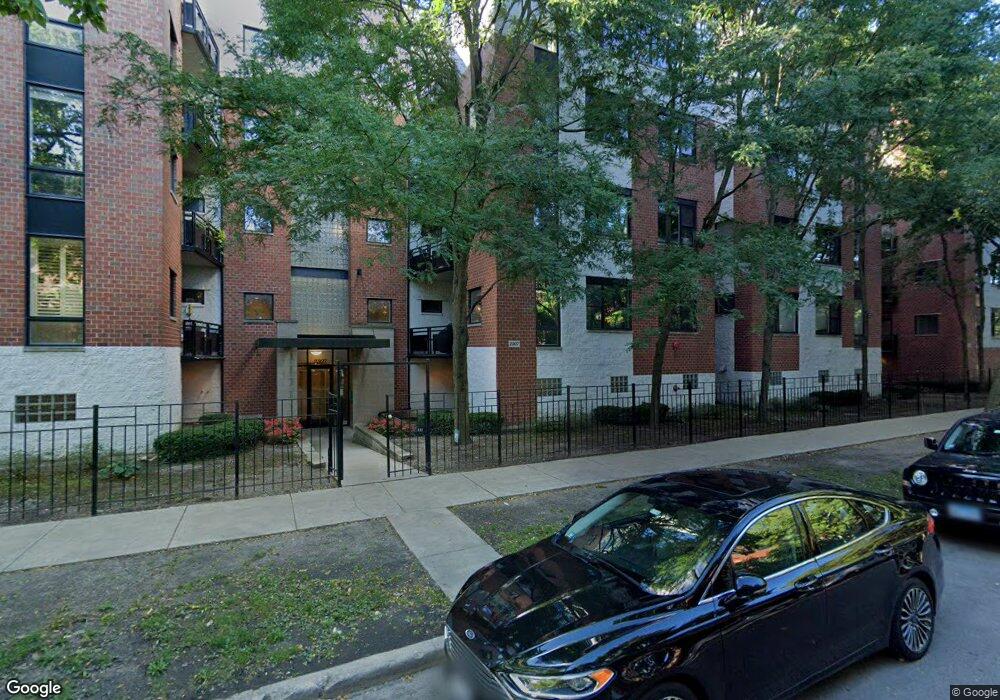
2307 W Wolfram St Unit PHASE1 Chicago, IL 60618
Bucktown NeighborhoodEstimated Value: $407,347 - $427,000
2
Beds
--
Bath
1,250
Sq Ft
$334/Sq Ft
Est. Value
About This Home
This home is located at 2307 W Wolfram St Unit PHASE1, Chicago, IL 60618 and is currently estimated at $418,087, approximately $334 per square foot. 2307 W Wolfram St Unit PHASE1 is a home located in Cook County with nearby schools including Brentano Math & Science Academy, Schurz High School, and Acero Charter - Carlos Fuentes Cmpus.
Ownership History
Date
Name
Owned For
Owner Type
Purchase Details
Closed on
Aug 21, 2013
Sold by
Haskell Robert
Bought by
Haskell Robert and The Robert Haskell Revocable Trust
Current Estimated Value
Purchase Details
Closed on
Sep 9, 2007
Sold by
Hulen James D
Bought by
Haskell Robert
Home Financials for this Owner
Home Financials are based on the most recent Mortgage that was taken out on this home.
Original Mortgage
$299,277
Outstanding Balance
$190,064
Interest Rate
6.63%
Mortgage Type
Unknown
Estimated Equity
$228,023
Purchase Details
Closed on
Mar 30, 2001
Sold by
Towers Wolfram
Bought by
Hulen James D
Home Financials for this Owner
Home Financials are based on the most recent Mortgage that was taken out on this home.
Original Mortgage
$194,400
Interest Rate
7.05%
Create a Home Valuation Report for This Property
The Home Valuation Report is an in-depth analysis detailing your home's value as well as a comparison with similar homes in the area
Home Values in the Area
Average Home Value in this Area
Purchase History
| Date | Buyer | Sale Price | Title Company |
|---|---|---|---|
| Haskell Robert | -- | None Available | |
| Haskell Robert | $333,000 | First American Title | |
| Hulen James D | $243,000 | First American Title |
Source: Public Records
Mortgage History
| Date | Status | Borrower | Loan Amount |
|---|---|---|---|
| Open | Haskell Robert | $299,277 | |
| Previous Owner | Hulen James D | $194,400 |
Source: Public Records
Tax History Compared to Growth
Tax History
| Year | Tax Paid | Tax Assessment Tax Assessment Total Assessment is a certain percentage of the fair market value that is determined by local assessors to be the total taxable value of land and additions on the property. | Land | Improvement |
|---|---|---|---|---|
| 2024 | $5,326 | $33,868 | $4,414 | $29,454 |
| 2023 | $5,169 | $28,470 | $2,029 | $26,441 |
| 2022 | $5,169 | $28,470 | $2,029 | $26,441 |
| 2021 | $5,072 | $28,468 | $2,028 | $26,440 |
| 2020 | $5,169 | $26,222 | $2,028 | $24,194 |
| 2019 | $5,156 | $28,999 | $2,028 | $26,971 |
| 2018 | $5,050 | $28,999 | $2,028 | $26,971 |
| 2017 | $4,345 | $23,558 | $1,779 | $21,779 |
| 2016 | $4,218 | $23,558 | $1,779 | $21,779 |
| 2015 | $3,836 | $23,558 | $1,779 | $21,779 |
| 2014 | $3,172 | $19,666 | $1,441 | $18,225 |
| 2013 | $3,099 | $19,666 | $1,441 | $18,225 |
Source: Public Records
Map
Nearby Homes
- 2337 W Wolfram St Unit 415
- 2337 W Wolfram St Unit 411
- 2864 N Riverwalk Dr
- 2832 N Riverwalk Dr
- 2823 N Oakley Ave Unit K
- 2801 N Oakley Ave Unit 202
- 2222 W Diversey Ave Unit 407
- 2444 W Diversey Ave Unit 1W
- 2727 N Artesian Ave
- 2235 W Oakdale Ave Unit 22-C
- 2235 W Oakdale Ave Unit 12-D
- 2235 W Oakdale Ave Unit 11-D
- 2235 W Oakdale Ave Unit 4-D
- 2235 W Oakdale Ave Unit 13-E
- 2235 W Oakdale Ave Unit 17-B
- 2235 W Oakdale Ave Unit 10-C
- 2235 W Oakdale Ave Unit 9-C
- 2235 W Oakdale Ave Unit 2-D
- 2235 W Oakdale Ave Unit 15-C
- 2235 W Oakdale Ave Unit 18-B
- 2307 W Wolfram St Unit 314
- 2307 W Wolfram St Unit 513
- 2307 W Wolfram St Unit 315
- 2307 W Wolfram St
- 2307 W Wolfram St Unit 312
- 2307 W Wolfram St Unit 214
- 2307 W Wolfram St Unit 212
- 2307 W Wolfram St Unit 514
- 2307 W Wolfram St Unit PHASE1
- 2307 W Wolfram St Unit PHASE1
- 2307 W Wolfram St Unit PHASE1
- 2307 W Wolfram St Unit PHASE1
- 2307 W Wolfram St Unit PHASE1
- 2307 W Wolfram St Unit PHASE1
- 2307 W Wolfram St Unit PHASE1
- 2307 W Wolfram St Unit PHASE1
- 2307 W Wolfram St Unit PHASE1
- 2307 W Wolfram St Unit PHASE1
- 2307 W Wolfram St Unit PHASE1
- 2307 W Wolfram St Unit PHASE1