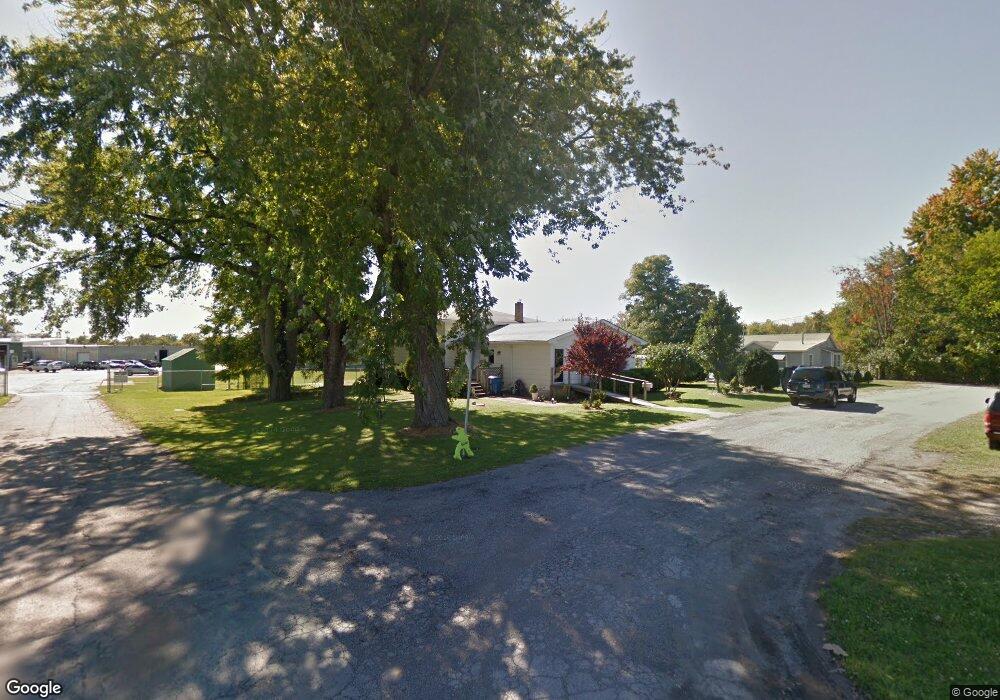
2308 Barker St Sandusky, OH 44870
Estimated Value: $179,000 - $211,000
4
Beds
2
Baths
2,794
Sq Ft
$69/Sq Ft
Est. Value
About This Home
This home is located at 2308 Barker St, Sandusky, OH 44870 and is currently estimated at $193,586, approximately $69 per square foot. 2308 Barker St is a home located in Erie County with nearby schools including Sandusky High School, Monroe Preparatory Academy, and Sandusky Central Catholic School.
Ownership History
Date
Name
Owned For
Owner Type
Purchase Details
Closed on
Apr 4, 2023
Sold by
Nagel Carl F
Bought by
Nagel Carl F and Stanley Theresa
Current Estimated Value
Home Financials for this Owner
Home Financials are based on the most recent Mortgage that was taken out on this home.
Original Mortgage
$93,000
Outstanding Balance
$90,052
Interest Rate
6.65%
Mortgage Type
New Conventional
Estimated Equity
$103,534
Purchase Details
Closed on
Feb 14, 2022
Sold by
Stanley Theresa C
Bought by
Nagel Carl F
Purchase Details
Closed on
Jan 25, 2017
Sold by
Nagel Carl F and Nagel Helen L
Bought by
Nagel Carl F
Purchase Details
Closed on
Jan 1, 1987
Bought by
Nagel Carl F and Nagel Helen L
Create a Home Valuation Report for This Property
The Home Valuation Report is an in-depth analysis detailing your home's value as well as a comparison with similar homes in the area
Home Values in the Area
Average Home Value in this Area
Purchase History
| Date | Buyer | Sale Price | Title Company |
|---|---|---|---|
| Nagel Carl F | -- | None Listed On Document | |
| Nagel Carl F | $375 | Reminger Co Lpa | |
| Nagel Carl F | -- | None Available | |
| Nagel Carl F | -- | -- |
Source: Public Records
Mortgage History
| Date | Status | Borrower | Loan Amount |
|---|---|---|---|
| Open | Nagel Carl F | $93,000 |
Source: Public Records
Tax History
| Year | Tax Paid | Tax Assessment Tax Assessment Total Assessment is a certain percentage of the fair market value that is determined by local assessors to be the total taxable value of land and additions on the property. | Land | Improvement |
|---|---|---|---|---|
| 2024 | $1,747 | $46,976 | $5,645 | $41,331 |
| 2023 | $1,807 | $33,848 | $4,343 | $29,505 |
| 2022 | $1,304 | $33,848 | $4,343 | $29,505 |
| 2021 | $1,253 | $33,850 | $4,340 | $29,510 |
| 2020 | $1,315 | $32,970 | $4,340 | $28,630 |
| 2019 | $1,353 | $32,970 | $4,340 | $28,630 |
| 2018 | $1,354 | $32,970 | $4,340 | $28,630 |
| 2017 | $1,567 | $36,670 | $4,670 | $32,000 |
| 2016 | $1,566 | $36,670 | $4,670 | $32,000 |
| 2015 | $1,429 | $36,990 | $4,670 | $32,320 |
| 2014 | $1,421 | $36,990 | $4,670 | $32,320 |
| 2013 | $1,406 | $36,990 | $4,670 | $32,320 |
Source: Public Records
Map
Nearby Homes
- 1805 Mills St
- 1807 Mills St
- 427 Windcrest Ct
- 1513 Pearl St
- 1318 Tyler St
- 1329 Carr St
- 1308 W Madison St
- 1330 Carr St
- 911 A St
- 1225 W Osborne St
- 1720 Buchanan St
- 34 Anderson St
- 2103 Putnam St
- 1333 Shelby St
- 1204 W Monroe St
- 1311 Filmore St
- 1019 Winnebago Ave
- 2125 Stahlwood Dr
- 1 Perkins Ave
- 1105 W Adams St
Your Personal Tour Guide
Ask me questions while you tour the home.