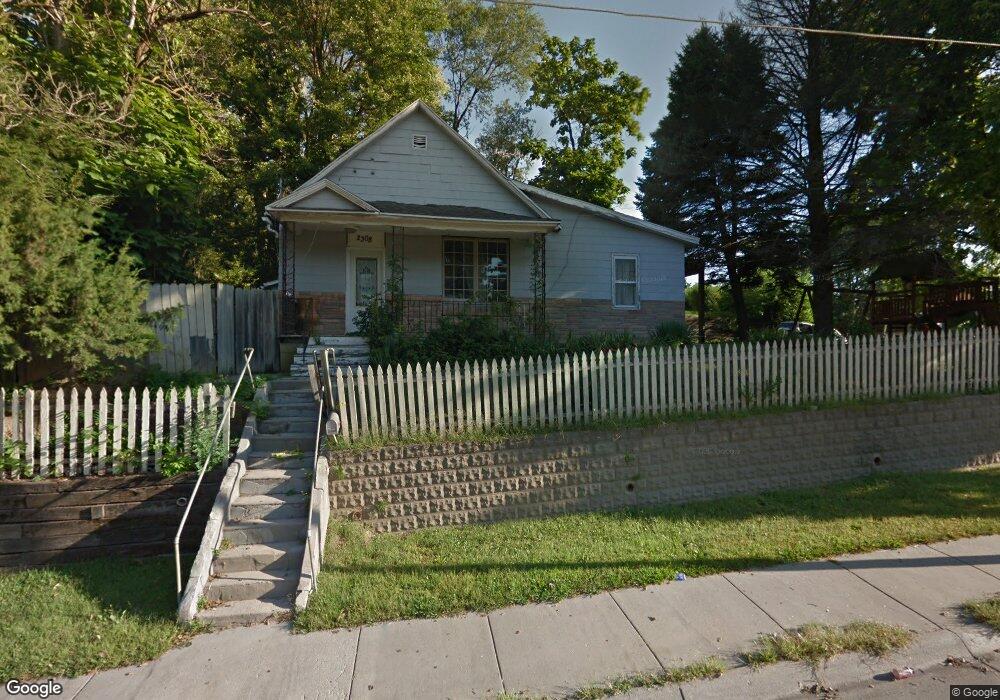
2308 Q St Omaha, NE 68107
Brown Park NeighborhoodEstimated Value: $100,000 - $158,000
3
Beds
2
Baths
1,207
Sq Ft
$110/Sq Ft
Est. Value
About This Home
This home is located at 2308 Q St, Omaha, NE 68107 and is currently estimated at $132,667, approximately $109 per square foot. 2308 Q St is a home located in Douglas County with nearby schools including Gomez Heritage Elementary School, R.M. Marrs Magnet Middle School, and South High School.
Ownership History
Date
Name
Owned For
Owner Type
Purchase Details
Closed on
Mar 13, 2009
Sold by
Ew Properties Llc
Bought by
Puentes Jose S
Current Estimated Value
Purchase Details
Closed on
May 30, 2008
Sold by
Wells Fargo Na Tr
Bought by
Ew Properties Llc
Purchase Details
Closed on
Sep 28, 2001
Sold by
Jacinto Aristeo L and Lara Ariesteo J
Bought by
Valadez Maria Dejesus Jacinto and Valadez Rodrigo Jacinto
Create a Home Valuation Report for This Property
The Home Valuation Report is an in-depth analysis detailing your home's value as well as a comparison with similar homes in the area
Home Values in the Area
Average Home Value in this Area
Purchase History
| Date | Buyer | Sale Price | Title Company |
|---|---|---|---|
| Puentes Jose S | $58,000 | -- | |
| Ew Properties Llc | $28,100 | -- | |
| Valadez Maria Dejesus Jacinto | $42,000 | -- |
Source: Public Records
Tax History Compared to Growth
Tax History
| Year | Tax Paid | Tax Assessment Tax Assessment Total Assessment is a certain percentage of the fair market value that is determined by local assessors to be the total taxable value of land and additions on the property. | Land | Improvement |
|---|---|---|---|---|
| 2024 | $1,458 | $66,200 | $12,000 | $54,200 |
| 2023 | $1,458 | $69,100 | $12,000 | $57,100 |
| 2022 | $1,377 | $64,500 | $7,400 | $57,100 |
| 2021 | $1,365 | $64,500 | $7,400 | $57,100 |
| 2020 | $1,248 | $58,300 | $7,400 | $50,900 |
| 2019 | $1,039 | $48,400 | $7,400 | $41,000 |
| 2018 | $1,170 | $54,400 | $7,400 | $47,000 |
| 2017 | $1,175 | $54,400 | $7,400 | $47,000 |
| 2016 | $1,112 | $51,800 | $4,800 | $47,000 |
| 2015 | $1,097 | $51,800 | $4,800 | $47,000 |
| 2014 | $1,097 | $51,800 | $4,800 | $47,000 |
Source: Public Records
Map
Nearby Homes