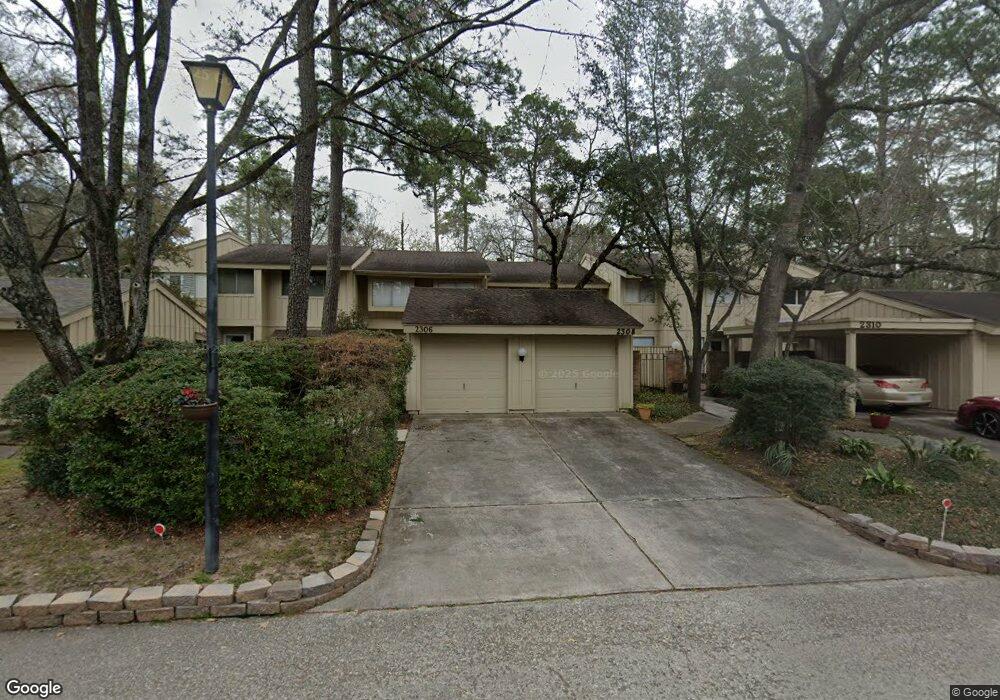
2308 W Settlers Way Spring, TX 77380
Grogan's Mill NeighborhoodEstimated Value: $262,760 - $335,000
3
Beds
3
Baths
1,498
Sq Ft
$205/Sq Ft
Est. Value
About This Home
This home is located at 2308 W Settlers Way, Spring, TX 77380 and is currently estimated at $306,690, approximately $204 per square foot. 2308 W Settlers Way is a home located in Montgomery County with nearby schools including Lamar Elementary School, W.D Wilkerson Intermediate School, and Knox J High School.
Ownership History
Date
Name
Owned For
Owner Type
Purchase Details
Closed on
Jul 11, 2012
Sold by
Robbins Robert C and Robbins Vanessa M
Bought by
Johns Janice L
Current Estimated Value
Home Financials for this Owner
Home Financials are based on the most recent Mortgage that was taken out on this home.
Original Mortgage
$122,637
Outstanding Balance
$85,134
Interest Rate
3.79%
Mortgage Type
FHA
Estimated Equity
$221,556
Purchase Details
Closed on
Jan 26, 2006
Sold by
Ezrailson Edward
Bought by
Johns Janice L
Home Financials for this Owner
Home Financials are based on the most recent Mortgage that was taken out on this home.
Original Mortgage
$85,613
Interest Rate
6.22%
Mortgage Type
Fannie Mae Freddie Mac
Purchase Details
Closed on
Mar 25, 1992
Sold by
Jensen Richard G
Bought by
Johns Janice L
Create a Home Valuation Report for This Property
The Home Valuation Report is an in-depth analysis detailing your home's value as well as a comparison with similar homes in the area
Home Values in the Area
Average Home Value in this Area
Purchase History
| Date | Buyer | Sale Price | Title Company |
|---|---|---|---|
| Johns Janice L | -- | None Available | |
| Johns Janice L | -- | -- | |
| Robbins Robert C | -- | Chicago Title | |
| Johns Janice L | -- | -- |
Source: Public Records
Mortgage History
| Date | Status | Borrower | Loan Amount |
|---|---|---|---|
| Open | Johns Janice L | $122,637 | |
| Previous Owner | Robbins Robert C | $85,613 | |
| Previous Owner | Johns Janice L | $21,404 |
Source: Public Records
Tax History Compared to Growth
Tax History
| Year | Tax Paid | Tax Assessment Tax Assessment Total Assessment is a certain percentage of the fair market value that is determined by local assessors to be the total taxable value of land and additions on the property. | Land | Improvement |
|---|---|---|---|---|
| 2025 | $1,236 | $212,097 | $40,000 | $172,097 |
| 2024 | $1,153 | $194,909 | -- | -- |
| 2023 | $1,153 | $177,190 | $40,000 | $160,710 |
| 2022 | $3,075 | $161,080 | $40,000 | $145,230 |
| 2021 | $2,997 | $146,440 | $11,000 | $135,440 |
| 2020 | $3,240 | $150,820 | $11,000 | $139,820 |
| 2019 | $3,430 | $155,070 | $11,000 | $144,070 |
| 2018 | $2,919 | $155,070 | $11,000 | $144,070 |
| 2017 | $3,483 | $155,070 | $11,000 | $144,070 |
| 2016 | $3,519 | $156,700 | $11,000 | $151,770 |
| 2015 | $2,729 | $142,450 | $11,000 | $159,380 |
| 2014 | $2,729 | $129,500 | $11,000 | $118,500 |
Source: Public Records
Map
Nearby Homes
- 2206 W Settlers Way
- 2421 W Settlers Way
- 2445 W Settlers Way
- 11407 Timberwild St
- 51 Huntsmans Horn Cir
- 108 S Timber Top Dr
- 5 Indian Cedar Ln
- 41 Eagle Ct
- 1904 Nursery Rd
- 1810 N Red Cedar Cir
- 1911 N Red Cedar Cir
- 12 Paintedcup Ct
- 16 Crinkleroot Ct
- 9 Paintedcup Ct
- 5 Buttonbush Ct
- 3 Black Cormorant Place
- 22 Cokeberry St
- 5 Maystar Ct
- 3 Star Fern Place
- 25 Vinebrook Rd
- 2306 W Settlers Way
- 2310 W Settlers Way
- 2304 W Settlers Way
- 2312 W Settlers Way
- 2302 W Settlers Way
- 2320 W Settlers Way
- 2322 W Settlers Way
- 2228 W Settlers Way
- 2322 W Settler's Way
- 2224 W Settlers Way
- 2344 E Settlers Way
- 2324 W Settlers Way
- 2222 W Settlers Way
- 2249 E Settlers Way Unit 2
- 2321 W Settlers Way
- 2451 E Settlers Way Unit 2451
- 2345 E Settlers Way
- 2265 E Settlers Way
- 2328 W Settlers Way
- 2311 W Settlers Way