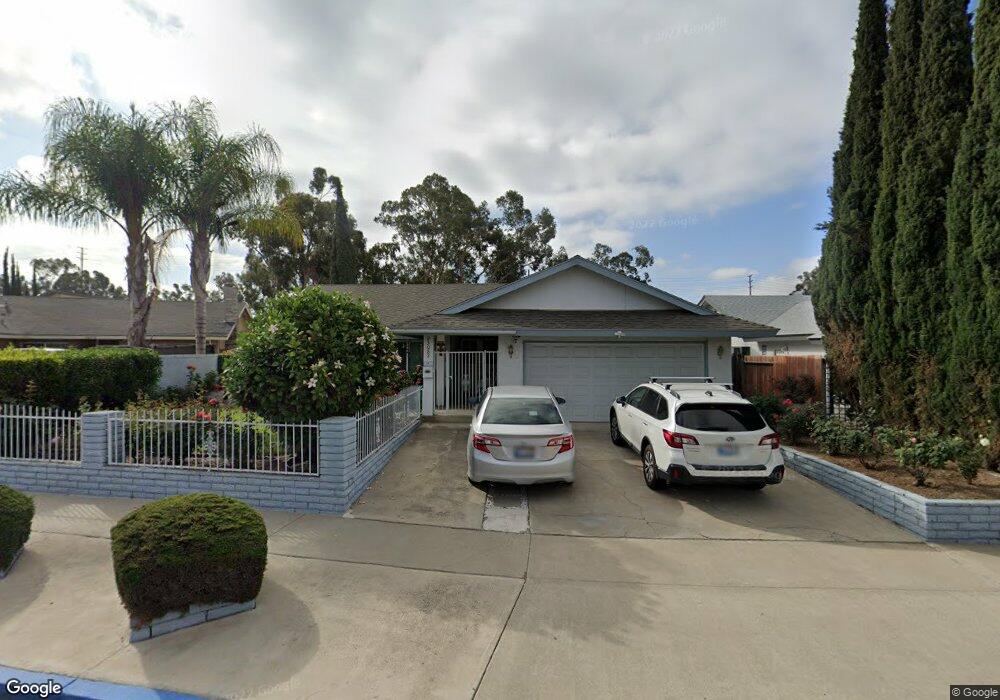
23082 La Vaca St Lake Forest, CA 92630
Estimated Value: $1,186,000 - $1,436,000
4
Beds
2
Baths
1,496
Sq Ft
$837/Sq Ft
Est. Value
About This Home
This home is located at 23082 La Vaca St, Lake Forest, CA 92630 and is currently estimated at $1,252,740, approximately $837 per square foot. 23082 La Vaca St is a home located in Orange County with nearby schools including Santiago STEAM Magnet Elementary School, Serrano Intermediate School, and El Toro High School.
Ownership History
Date
Name
Owned For
Owner Type
Purchase Details
Closed on
Aug 19, 2025
Sold by
Wulff Lance and Wulff Melinda Sue
Bought by
Lance Wulff And Melinda Sue Wullf 2011 Revoca and Wulff
Current Estimated Value
Purchase Details
Closed on
Feb 7, 1996
Sold by
Shafiee Fereshteh
Bought by
Wulff Lance and Wulff Melinda Sue
Home Financials for this Owner
Home Financials are based on the most recent Mortgage that was taken out on this home.
Original Mortgage
$178,100
Interest Rate
7.01%
Purchase Details
Closed on
Mar 17, 1994
Sold by
Cashman Robert J and Cashman Helen L
Bought by
Shafiee Fereshteh
Home Financials for this Owner
Home Financials are based on the most recent Mortgage that was taken out on this home.
Original Mortgage
$144,000
Interest Rate
5%
Create a Home Valuation Report for This Property
The Home Valuation Report is an in-depth analysis detailing your home's value as well as a comparison with similar homes in the area
Home Values in the Area
Average Home Value in this Area
Purchase History
| Date | Buyer | Sale Price | Title Company |
|---|---|---|---|
| Lance Wulff And Melinda Sue Wullf 2011 Revoca | -- | None Listed On Document | |
| Wulff Lance | $187,500 | Fidelity National Title Ins | |
| Shafiee Fereshteh | $180,000 | Chicago Title Company |
Source: Public Records
Mortgage History
| Date | Status | Borrower | Loan Amount |
|---|---|---|---|
| Previous Owner | Wulff Lance | $178,100 | |
| Previous Owner | Shafiee Fereshteh | $144,000 |
Source: Public Records
Tax History Compared to Growth
Tax History
| Year | Tax Paid | Tax Assessment Tax Assessment Total Assessment is a certain percentage of the fair market value that is determined by local assessors to be the total taxable value of land and additions on the property. | Land | Improvement |
|---|---|---|---|---|
| 2025 | $3,143 | $311,474 | $199,446 | $112,028 |
| 2024 | $3,143 | $305,367 | $195,535 | $109,832 |
| 2023 | $3,068 | $299,380 | $191,701 | $107,679 |
| 2022 | $3,012 | $293,510 | $187,942 | $105,568 |
| 2021 | $2,950 | $287,755 | $184,256 | $103,499 |
| 2020 | $2,923 | $284,805 | $182,367 | $102,438 |
| 2019 | $2,864 | $279,221 | $178,791 | $100,430 |
| 2018 | $2,809 | $273,747 | $175,286 | $98,461 |
| 2017 | $2,752 | $268,380 | $171,849 | $96,531 |
| 2016 | $2,705 | $263,118 | $168,479 | $94,639 |
| 2015 | $2,671 | $259,166 | $165,948 | $93,218 |
| 2014 | $2,611 | $254,090 | $162,698 | $91,392 |
Source: Public Records
Map
Nearby Homes
- 24841 Calle el Toro Grande
- 24811 Calle el Toro Grande
- 22941 Belquest Dr
- 23216 Orange Ave Unit 6
- 23214 Orange Ave Unit 7
- 23220 Orange Ave Unit 2
- 23220 Orange Ave Unit 9
- 23294 Orange Ave Unit 1
- 23292 Orange Ave Unit 6
- 23230 Orange Ave Unit 2
- 23288 Orange Ave Unit 5
- 24532 Corta Cresta Dr
- 23240 Orange Ave Unit 2
- 23240 Orange Ave Unit 8
- 23276 Orange Ave Unit 8
- 24921 Muirlands Blvd Unit 13
- 24921 Muirlands Blvd Unit 79
- 24921 Muirlands Blvd Unit 265
- 24921 Muirlands Blvd Unit 202
- 24921 Muirlands Blvd Unit 216
- 23092 La Vaca St
- 23072 La Vaca St
- 23102 La Vaca St
- 23161 Saguaro St
- 23151 Saguaro St
- 24872 Calle el Toro Grande
- 23171 Saguaro St
- 23062 La Vaca St
- 23106 La Vaca St
- 24831 Lobo Dr
- 24881 Calle el Toro Grande
- 23181 Saguaro St
- 24862 Calle el Toro Grande
- 23112 La Vaca St
- 24871 Calle el Toro Grande
- 23141 Saguaro St Unit B
- 23143 Saguaro St Unit A
- 23143 Saguaro St
- 24821 Lobo Dr
- 23162 Saguaro St Unit D