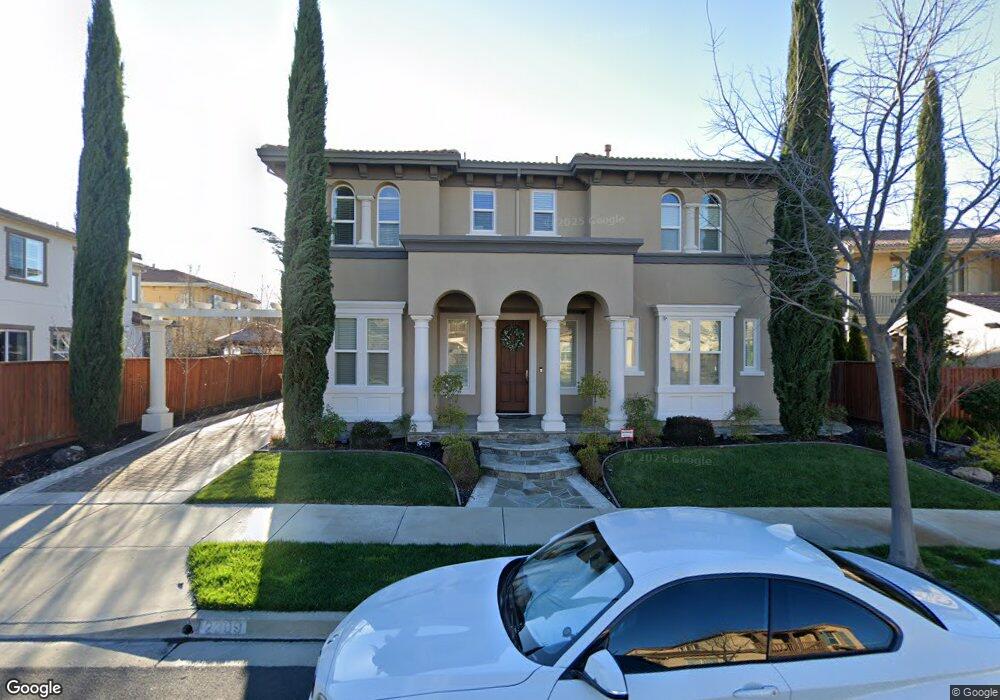
2309 Avalon Way San Ramon, CA 94582
Gale Ranch-Windemere NeighborhoodEstimated Value: $2,595,892 - $2,666,000
5
Beds
5
Baths
4,118
Sq Ft
$638/Sq Ft
Est. Value
About This Home
This home is located at 2309 Avalon Way, San Ramon, CA 94582 and is currently estimated at $2,628,223, approximately $638 per square foot. 2309 Avalon Way is a home located in Contra Costa County with nearby schools including Hidden Hills Elementary School, Windemere Ranch Middle School, and Dougherty Valley High School.
Ownership History
Date
Name
Owned For
Owner Type
Purchase Details
Closed on
Dec 24, 2008
Sold by
Sales Perry J and Sales Belle L
Bought by
Sales Perry J and Sales Belle L
Current Estimated Value
Home Financials for this Owner
Home Financials are based on the most recent Mortgage that was taken out on this home.
Original Mortgage
$729,250
Outstanding Balance
$479,489
Interest Rate
6.03%
Mortgage Type
Stand Alone Refi Refinance Of Original Loan
Estimated Equity
$2,148,734
Purchase Details
Closed on
Jun 27, 2006
Sold by
Sales Perry J and Sales Belle L
Bought by
Sales Perry J and Sales Belle L
Purchase Details
Closed on
Sep 10, 2004
Sold by
Greystone Homes Inc
Bought by
Sales Perry J and Lo Belle
Home Financials for this Owner
Home Financials are based on the most recent Mortgage that was taken out on this home.
Original Mortgage
$807,550
Interest Rate
5%
Mortgage Type
Purchase Money Mortgage
Create a Home Valuation Report for This Property
The Home Valuation Report is an in-depth analysis detailing your home's value as well as a comparison with similar homes in the area
Home Values in the Area
Average Home Value in this Area
Purchase History
| Date | Buyer | Sale Price | Title Company |
|---|---|---|---|
| Sales Perry J | -- | Accommodation | |
| Sales Perry J | -- | Placer Title Company | |
| Sales Perry J | -- | None Available | |
| Sales Perry J | $1,077,000 | North American Title |
Source: Public Records
Mortgage History
| Date | Status | Borrower | Loan Amount |
|---|---|---|---|
| Open | Sales Perry J | $729,250 | |
| Previous Owner | Sales Perry J | $807,550 |
Source: Public Records
Tax History Compared to Growth
Tax History
| Year | Tax Paid | Tax Assessment Tax Assessment Total Assessment is a certain percentage of the fair market value that is determined by local assessors to be the total taxable value of land and additions on the property. | Land | Improvement |
|---|---|---|---|---|
| 2025 | $23,467 | $1,558,519 | $543,621 | $1,014,898 |
| 2024 | $23,204 | $1,527,961 | $532,962 | $994,999 |
| 2023 | $23,204 | $1,498,002 | $522,512 | $975,490 |
| 2022 | $22,722 | $1,468,630 | $512,267 | $956,363 |
| 2021 | $22,333 | $1,439,834 | $502,223 | $937,611 |
| 2019 | $21,826 | $1,397,129 | $487,328 | $909,801 |
| 2018 | $21,298 | $1,369,735 | $477,773 | $891,962 |
| 2017 | $21,133 | $1,342,878 | $468,405 | $874,473 |
| 2016 | $20,791 | $1,316,548 | $459,221 | $857,327 |
| 2015 | $20,371 | $1,296,774 | $452,324 | $844,450 |
| 2014 | $19,432 | $1,201,500 | $419,092 | $782,408 |
Source: Public Records
Map
Nearby Homes
- 6278 Murdock Way
- 1132 Hoskins Ln
- 224 Riverland Ct
- 1628 Banbury Dr
- 6130 Yardley Ln
- 3055 Hastings Way
- 1236 Andreas Way
- 5430 Sherwood Way
- 5300 Fioli Loop
- 2392 Millstream Ln
- 2165 Watermill Rd Unit 54
- 2073 Watermill Rd
- 1412 Arianna Ln
- 5132 Fioli Loop
- 6132 Alpine Blue Dr
- 1038 S Monarch Rd
- 5110 Rowan Dr
- 4247 Healdsburg Way
- 4440 Pine Mountain Way
- 4386 Healdsburg Way
- 2315 Avalon Way
- 2015 Longleaf Cir
- 2009 Longleaf Cir
- 2321 Avalon Way
- 2027 Longleaf Cir
- 2316 Avalon Way
- 2327 Avalon Way
- 2322 Avalon Way
- 2033 Longleaf Cir
- 2328 Avalon Way
- 2333 Avalon Way
- 2506 Tamworth Ln
- 2512 Tamworth Ln
- 2012 Longleaf Cir
- 2018 Longleaf Cir
- 2006 Longleaf Cir
- 2500 Tamworth Ln
- 2022 Longleaf Cir
- 2000 Longleaf Cir
- 2518 Tamworth Ln