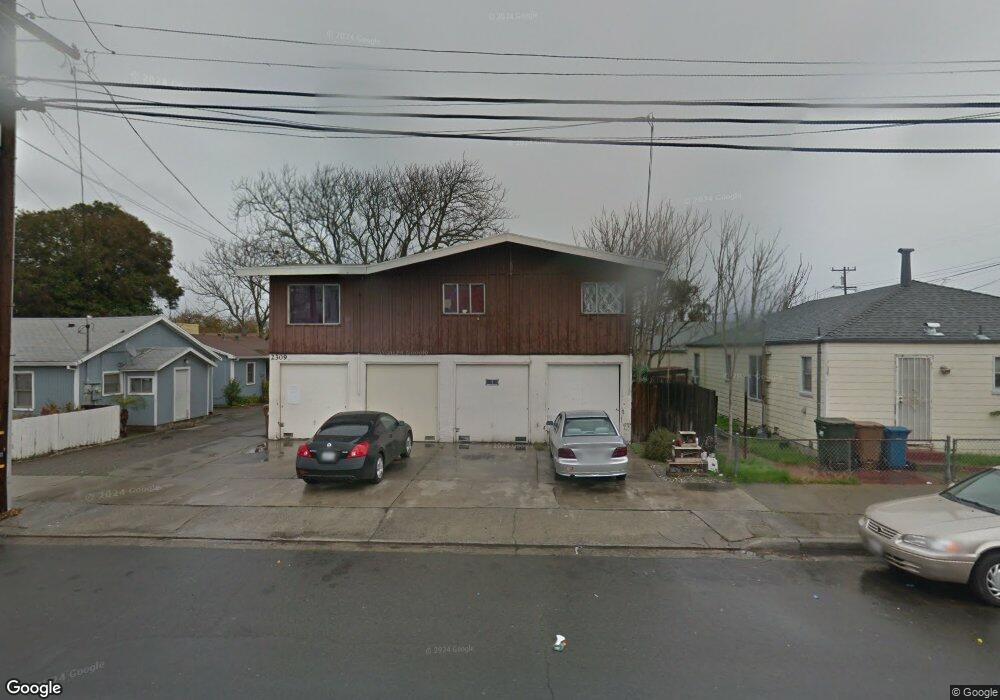
2309 D St Antioch, CA 94509
North Antioch NeighborhoodEstimated Value: $549,745 - $661,000
Studio
--
Bath
3,424
Sq Ft
$175/Sq Ft
Est. Value
About This Home
This home is located at 2309 D St, Antioch, CA 94509 and is currently estimated at $599,582, approximately $175 per square foot. 2309 D St is a home located in Contra Costa County with nearby schools including Marsh Elementary School, Antioch Middle School, and Antioch High School.
Ownership History
Date
Name
Owned For
Owner Type
Purchase Details
Closed on
Aug 27, 2001
Sold by
Ridings Daniel and Ridings Lise
Bought by
Davidson Kevin and Davidson Karen
Current Estimated Value
Home Financials for this Owner
Home Financials are based on the most recent Mortgage that was taken out on this home.
Original Mortgage
$169,000
Outstanding Balance
$66,381
Interest Rate
7.09%
Mortgage Type
Purchase Money Mortgage
Estimated Equity
$533,201
Purchase Details
Closed on
Jan 14, 1999
Sold by
Johnson Richard & Alice Liv Tr
Bought by
Ridings Daniel and Ridings Lise
Home Financials for this Owner
Home Financials are based on the most recent Mortgage that was taken out on this home.
Original Mortgage
$120,400
Interest Rate
6.63%
Mortgage Type
Stand Alone First
Create a Home Valuation Report for This Property
The Home Valuation Report is an in-depth analysis detailing your home's value as well as a comparison with similar homes in the area
Home Values in the Area
Average Home Value in this Area
Purchase History
| Date | Buyer | Sale Price | Title Company |
|---|---|---|---|
| Davidson Kevin | $229,000 | Chicago Title Co | |
| Ridings Daniel | -- | First American Title Guarant |
Source: Public Records
Mortgage History
| Date | Status | Borrower | Loan Amount |
|---|---|---|---|
| Open | Davidson Kevin | $169,000 | |
| Previous Owner | Ridings Daniel | $120,400 |
Source: Public Records
Tax History
| Year | Tax Paid | Tax Assessment Tax Assessment Total Assessment is a certain percentage of the fair market value that is determined by local assessors to be the total taxable value of land and additions on the property. | Land | Improvement |
|---|---|---|---|---|
| 2025 | $5,998 | $338,277 | $112,753 | $225,524 |
| 2024 | $5,581 | $331,645 | $110,543 | $221,102 |
| 2023 | $5,581 | $325,143 | $108,376 | $216,767 |
| 2022 | $5,519 | $318,768 | $106,251 | $212,517 |
| 2021 | $5,301 | $312,518 | $104,168 | $208,350 |
| 2019 | $5,133 | $303,250 | $101,079 | $202,171 |
| 2018 | $4,948 | $297,305 | $99,098 | $198,207 |
| 2017 | $4,791 | $291,476 | $97,155 | $194,321 |
| 2016 | $4,645 | $285,761 | $95,250 | $190,511 |
| 2015 | $4,553 | $281,470 | $93,820 | $187,650 |
| 2014 | $4,394 | $275,958 | $91,983 | $183,975 |
Source: Public Records
Map
Nearby Homes
Your Personal Tour Guide
Ask me questions while you tour the home.