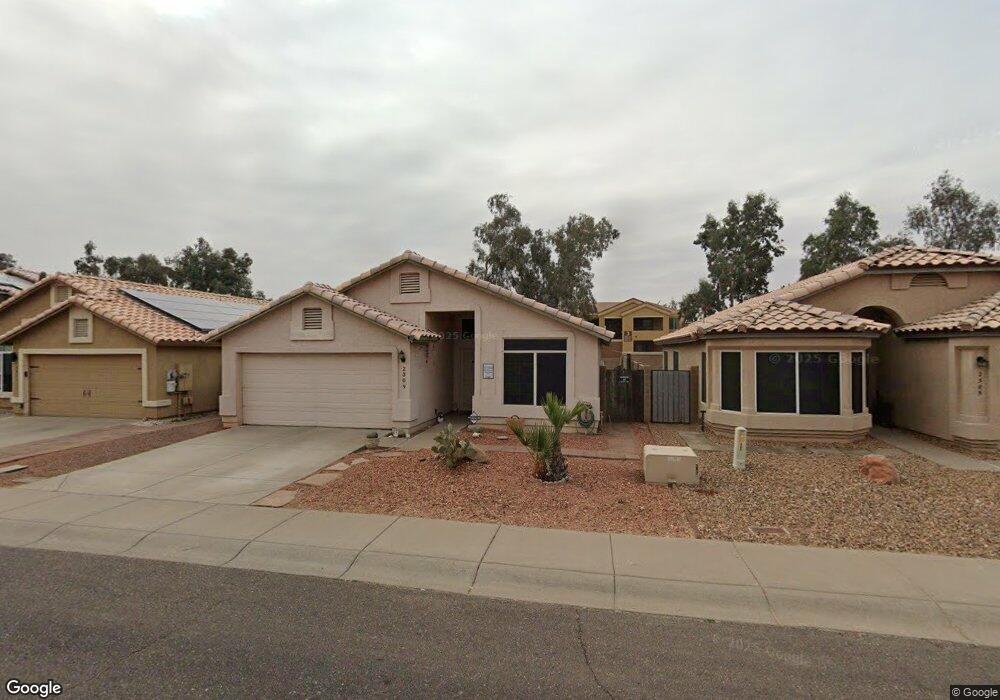
2309 E Morrow Dr Phoenix, AZ 85024
Paradise Valley Village NeighborhoodEstimated Value: $402,863 - $461,000
3
Beds
2
Baths
1,545
Sq Ft
$285/Sq Ft
Est. Value
About This Home
This home is located at 2309 E Morrow Dr, Phoenix, AZ 85024 and is currently estimated at $440,716, approximately $285 per square foot. 2309 E Morrow Dr is a home located in Maricopa County with nearby schools including Eagle Ridge Elementary School, Mountain Trail Middle School, and North Canyon High School.
Ownership History
Date
Name
Owned For
Owner Type
Purchase Details
Closed on
Aug 12, 2012
Sold by
Nacev Kostadin Stefanov and Naceva Nikolina Dimitrova
Bought by
Nace Dean Steven and Nace Nikolina Dimirova
Current Estimated Value
Purchase Details
Closed on
Mar 11, 2011
Sold by
Legenzoski Raymond J and Legenzoski Janette Y
Bought by
Nacev Kostadin S and Naceva Nikolina D
Home Financials for this Owner
Home Financials are based on the most recent Mortgage that was taken out on this home.
Original Mortgage
$112,084
Interest Rate
4.72%
Mortgage Type
FHA
Purchase Details
Closed on
Jan 17, 1995
Sold by
First American Title Insurance Company
Bought by
Legenzoski Raymond J and Legenzoski Janette Y
Home Financials for this Owner
Home Financials are based on the most recent Mortgage that was taken out on this home.
Original Mortgage
$94,100
Interest Rate
9.16%
Mortgage Type
New Conventional
Create a Home Valuation Report for This Property
The Home Valuation Report is an in-depth analysis detailing your home's value as well as a comparison with similar homes in the area
Home Values in the Area
Average Home Value in this Area
Purchase History
| Date | Buyer | Sale Price | Title Company |
|---|---|---|---|
| Nace Dean Steven | -- | None Available | |
| Nacev Kostadin S | $115,000 | Equity Title Agency Inc | |
| Legenzoski Raymond J | $101,686 | First American Title |
Source: Public Records
Mortgage History
| Date | Status | Borrower | Loan Amount |
|---|---|---|---|
| Previous Owner | Nacev Kostadin S | $112,084 | |
| Previous Owner | Legenzoski Raymond J | $94,100 |
Source: Public Records
Tax History
| Year | Tax Paid | Tax Assessment Tax Assessment Total Assessment is a certain percentage of the fair market value that is determined by local assessors to be the total taxable value of land and additions on the property. | Land | Improvement |
|---|---|---|---|---|
| 2025 | $1,772 | $20,469 | -- | -- |
| 2024 | $1,688 | $19,495 | -- | -- |
| 2023 | $1,688 | $32,580 | $6,510 | $26,070 |
| 2022 | $1,672 | $24,960 | $4,990 | $19,970 |
| 2021 | $1,699 | $23,370 | $4,670 | $18,700 |
| 2020 | $1,641 | $21,950 | $4,390 | $17,560 |
| 2019 | $1,649 | $20,380 | $4,070 | $16,310 |
| 2018 | $1,589 | $18,260 | $3,650 | $14,610 |
| 2017 | $1,517 | $17,360 | $3,470 | $13,890 |
| 2016 | $1,493 | $16,650 | $3,330 | $13,320 |
| 2015 | $1,385 | $14,860 | $2,970 | $11,890 |
Source: Public Records
Map
Nearby Homes
- 2412 E Rosemonte Dr
- 2403 E Rosemonte Dr
- 18908 N 22nd St
- 18611 N 22nd St Unit 44
- 19007 N 25th St
- 18812 N 22nd St
- 18416 N Cave Creek Rd Unit 1003
- 18416 N Cave Creek Rd Unit 1041
- 18416 N Cave Creek Rd Unit 3057
- 18416 N Cave Creek Rd Unit 2069
- 19226 N Cave Creek Rd Unit 128 to 139
- 18644 N 21st St
- 2120 E Bluefield Ave Unit 108
- 2530 E Wagoner Rd
- 19225 N Cave Creek Rd Unit 70
- 19225 N Cave Creek Rd Unit 83
- 19225 N Cave Creek Rd Unit 52
- 2535 E Villa Theresa Dr
- 2221 E Union Hills Dr Unit 137
- 2140 E Michigan Ave Unit 31
- 2305 E Morrow Dr
- 2311 E Morrow Dr
- 2251 E Morrow Dr
- 2315 E Morrow Dr
- 2247 E Morrow Dr
- 2308 E Morrow Dr
- 2310 E Morrow Dr
- 2304 E Morrow Dr
- 18819 N 23rd Place
- 2243 E Morrow Dr
- 2248 E Morrow Dr
- 18823 N 23rd Place
- 2244 E Morrow Dr
- 18827 N 23rd Place
- 2239 E Morrow Dr
- 2240 E Morrow Dr
- 2305 E Siesta Ln
- 2235 E Morrow Dr
- 2309 E Siesta Ln
- 2301 E Siesta Ln
Your Personal Tour Guide
Ask me questions while you tour the home.