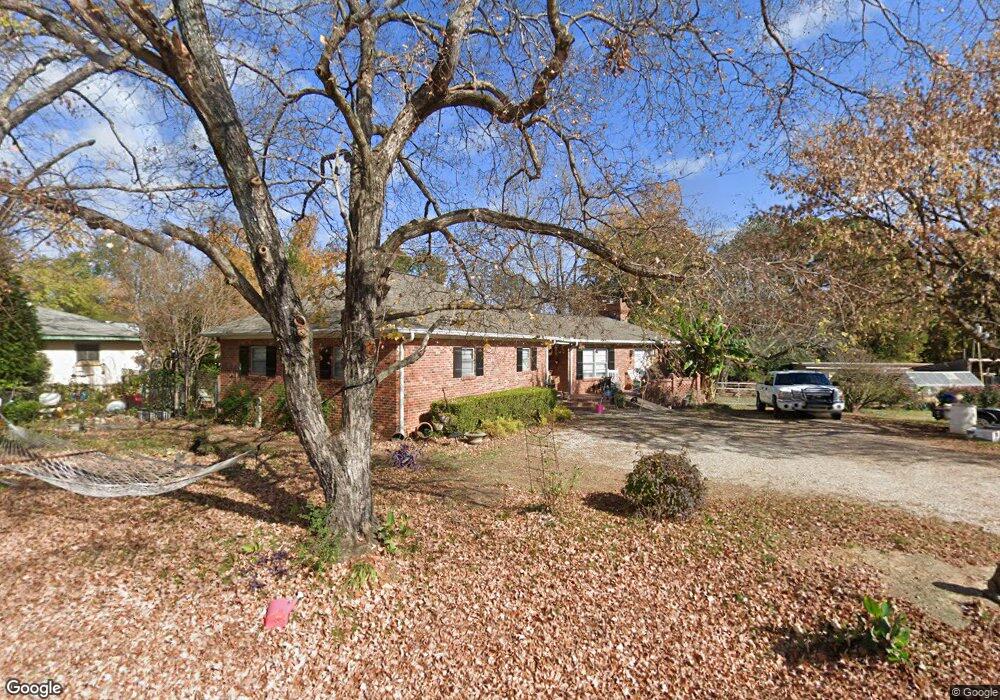
231 Bashford Rd Raleigh, NC 27606
West Raleigh NeighborhoodEstimated Value: $403,816 - $464,000
3
Beds
2
Baths
1,859
Sq Ft
$237/Sq Ft
Est. Value
About This Home
This home is located at 231 Bashford Rd, Raleigh, NC 27606 and is currently estimated at $441,454, approximately $237 per square foot. 231 Bashford Rd is a home located in Wake County with nearby schools including Reedy Creek Elementary School, Reedy Creek Magnet Middle School, and GRACE Christian School.
Ownership History
Date
Name
Owned For
Owner Type
Purchase Details
Closed on
Apr 27, 2021
Sold by
Waller Betty S
Bought by
231 Bashford Llc
Current Estimated Value
Purchase Details
Closed on
Jul 5, 2012
Sold by
Gaston Tammy J and Lindsey Tammy
Bought by
Waller Betty
Purchase Details
Closed on
Oct 20, 2008
Sold by
Lindsey Brian and Lindsey Tammy
Bought by
Lindsey Tammy and Gaston Tammy June
Home Financials for this Owner
Home Financials are based on the most recent Mortgage that was taken out on this home.
Original Mortgage
$155,000
Interest Rate
5.89%
Mortgage Type
New Conventional
Purchase Details
Closed on
Jan 8, 2001
Sold by
Loveall Loren S
Bought by
Lindsey Brian and Lindsey Tammy
Home Financials for this Owner
Home Financials are based on the most recent Mortgage that was taken out on this home.
Original Mortgage
$134,805
Interest Rate
7.44%
Create a Home Valuation Report for This Property
The Home Valuation Report is an in-depth analysis detailing your home's value as well as a comparison with similar homes in the area
Home Values in the Area
Average Home Value in this Area
Purchase History
| Date | Buyer | Sale Price | Title Company |
|---|---|---|---|
| 231 Bashford Llc | -- | None Available | |
| Waller Betty | $191,500 | None Available | |
| Lindsey Tammy | -- | None Available | |
| Lindsey Brian | $142,000 | -- |
Source: Public Records
Mortgage History
| Date | Status | Borrower | Loan Amount |
|---|---|---|---|
| Previous Owner | Lindsey Tammy | $155,000 | |
| Previous Owner | Lindsey Brian | $134,805 |
Source: Public Records
Tax History
| Year | Tax Paid | Tax Assessment Tax Assessment Total Assessment is a certain percentage of the fair market value that is determined by local assessors to be the total taxable value of land and additions on the property. | Land | Improvement |
|---|---|---|---|---|
| 2025 | $2,462 | $381,830 | $120,000 | $261,830 |
| 2024 | $2,391 | $381,830 | $120,000 | $261,830 |
Source: Public Records
Map
Nearby Homes
- 415 Bashford Rd
- 5608 Kimsey Ct
- 512 Bashford Rd
- 6403 Myra Rd
- 551 Oak Run Dr
- 6014 Farm Gate Rd
- 721 Orchard Vista Cir
- 723 Orchard Vista Cir
- 732 Orchard Vista Cir
- 730 Orchard Vista Cir
- 726 Orchard Vista Cir
- 724 Orchard Vista Cir
- 722 Orchard Vista Cir
- 720 Orchard Vista Cir
- 2027 Oakdale Dr
- 712 Godwin Ct
- 5920 Farm Gate Rd
- 701 Godwin Ct
- 10 Red Ln
- 1019 Sturdivant Dr
- 239 & 243 Bashford Rd
- 239 Bashford Rd
- 219 Bashford Rd
- 241 Bashford Rd Unit 2
- 241 Bashford Rd
- 225 Bashford Rd
- 223 Bashford Rd
- 243 Bashford Rd
- 243 Bashford Rd Unit 2
- 6038 Inona Place
- 6036 Inona Place
- 6034 Inona Place
- 6040 Inona Place
- 6032 Inona Place
- 6030 Inona Place
- 6028 Inona Place
- 6026 Inona Place
- 6044 Inona Place
- 6046 Inona Place
- 6048 Inona Place
Your Personal Tour Guide
Ask me questions while you tour the home.