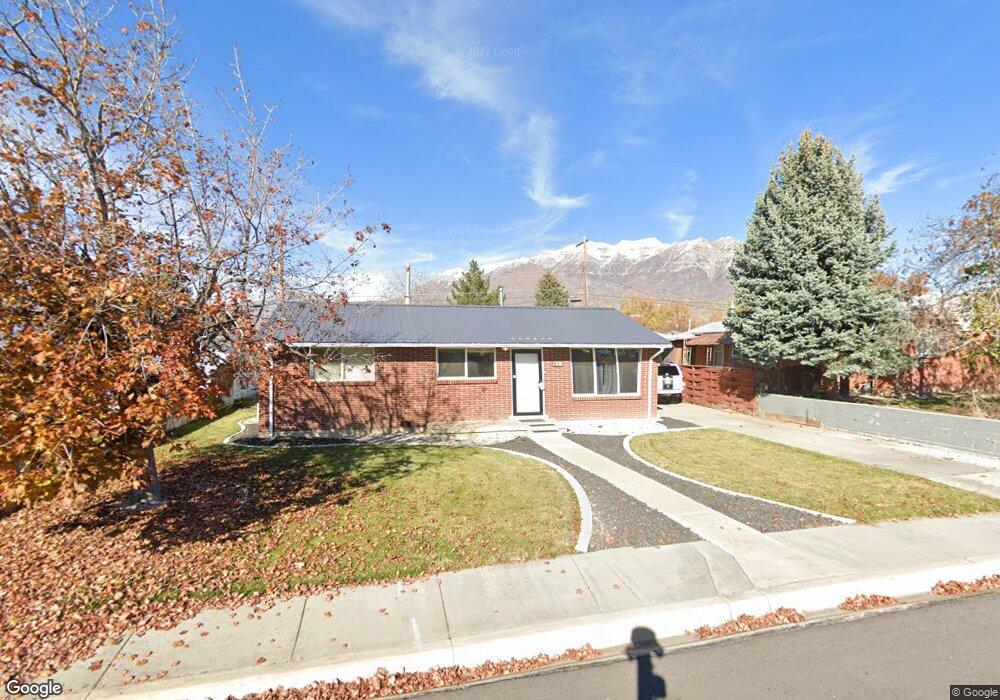
231 E 400 N Orem, UT 84057
Sharon NeighborhoodEstimated Value: $381,000 - $410,852
3
Beds
1
Bath
960
Sq Ft
$408/Sq Ft
Est. Value
About This Home
This home is located at 231 E 400 N, Orem, UT 84057 and is currently estimated at $391,617, approximately $407 per square foot. 231 E 400 N is a home located in Utah County with nearby schools including Cascade Elementary School, Canyon View Junior High School, and Orem High School.
Ownership History
Date
Name
Owned For
Owner Type
Purchase Details
Closed on
Jun 26, 2015
Sold by
Brown David M and Brown Heather L
Bought by
Wilkinson Jessica M
Current Estimated Value
Home Financials for this Owner
Home Financials are based on the most recent Mortgage that was taken out on this home.
Original Mortgage
$143,010
Outstanding Balance
$111,316
Interest Rate
3.81%
Mortgage Type
New Conventional
Estimated Equity
$280,302
Purchase Details
Closed on
Sep 9, 2009
Sold by
Robb David A and Robb Ash Lyn C
Bought by
Brown David M and Brown Heather L
Home Financials for this Owner
Home Financials are based on the most recent Mortgage that was taken out on this home.
Original Mortgage
$137,362
Interest Rate
5.25%
Mortgage Type
FHA
Create a Home Valuation Report for This Property
The Home Valuation Report is an in-depth analysis detailing your home's value as well as a comparison with similar homes in the area
Home Values in the Area
Average Home Value in this Area
Purchase History
| Date | Buyer | Sale Price | Title Company |
|---|---|---|---|
| Wilkinson Jessica M | -- | North American Title | |
| Brown David M | -- | Select Title Insurance Agen |
Source: Public Records
Mortgage History
| Date | Status | Borrower | Loan Amount |
|---|---|---|---|
| Open | Wilkinson Jessica M | $143,010 | |
| Previous Owner | Brown David M | $137,362 |
Source: Public Records
Tax History
| Year | Tax Paid | Tax Assessment Tax Assessment Total Assessment is a certain percentage of the fair market value that is determined by local assessors to be the total taxable value of land and additions on the property. | Land | Improvement |
|---|---|---|---|---|
| 2025 | $1,510 | $195,470 | -- | -- |
| 2024 | $1,510 | $184,580 | $0 | $0 |
| 2023 | $1,376 | $180,840 | $0 | $0 |
| 2022 | $1,491 | $189,860 | $0 | $0 |
| 2021 | $1,266 | $244,200 | $127,500 | $116,700 |
| 2020 | $1,142 | $216,400 | $102,000 | $114,400 |
| 2019 | $1,028 | $202,700 | $92,100 | $110,600 |
| 2018 | $950 | $178,900 | $82,200 | $96,700 |
| 2017 | $871 | $87,890 | $0 | $0 |
| 2016 | $787 | $73,205 | $0 | $0 |
| 2015 | $764 | $67,210 | $0 | $0 |
| 2014 | $757 | $66,330 | $0 | $0 |
Source: Public Records
Map
Nearby Homes
- 221 E 400 N
- 419 N 250 E
- 421 N 250 E Unit 515
- 427 N 250 E Unit 516
- 417 N 250 E Unit 514
- 429 N 250 E
- 429 N 250 E Unit 517
- 413 N 250 E Unit 513
- 207 E 400 N
- 207 E 400 N
- 409 N 250 E Unit 512
- 407 N 250 E Unit 511
- 230 E 400 N
- 403 N 250 E Unit 510
- 389 N 250 E
- 401 N 250 E Unit 509
- 224 E 400 N
- 418 N 250 E Unit 501
- 414 N 200 E
- 265 E 400 N
Your Personal Tour Guide
Ask me questions while you tour the home.