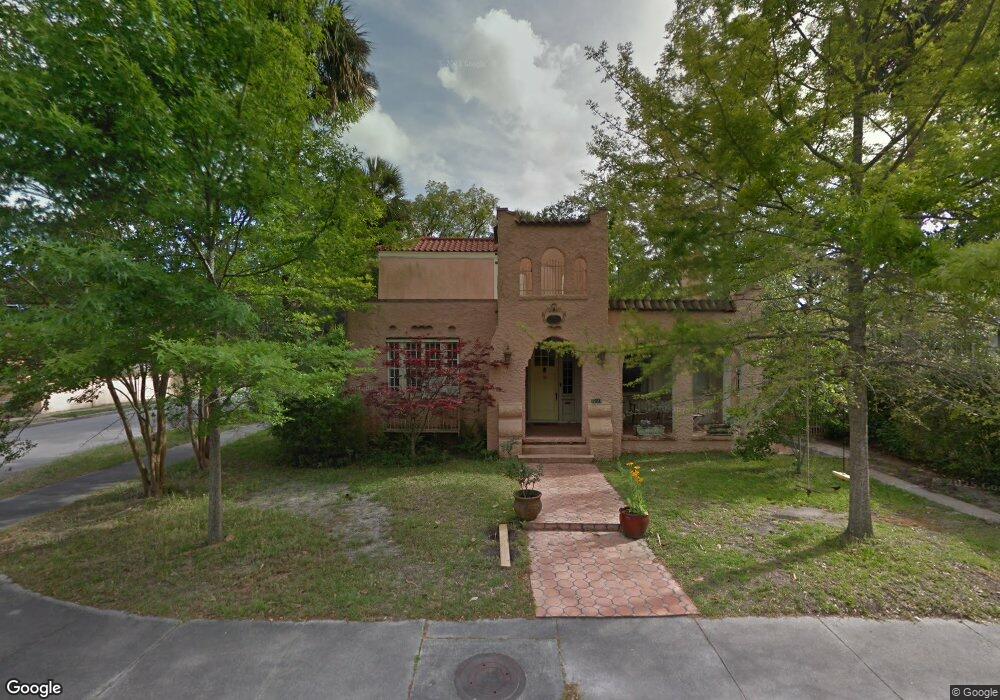
231 E 51st St Savannah, GA 31405
Ardsley Park-Chatham Crescent NeighborhoodEstimated Value: $549,627 - $677,000
4
Beds
2
Baths
2,022
Sq Ft
$297/Sq Ft
Est. Value
About This Home
This home is located at 231 E 51st St, Savannah, GA 31405 and is currently estimated at $601,407, approximately $297 per square foot. 231 E 51st St is a home located in Chatham County with nearby schools including Jacob G. Smith Elementary School, Myers Middle School, and Beach High School.
Ownership History
Date
Name
Owned For
Owner Type
Purchase Details
Closed on
Oct 8, 2019
Sold by
Dengiz Esma B
Bought by
Dengiz Esma B and Olin Samuel Scotford
Current Estimated Value
Purchase Details
Closed on
Dec 18, 2006
Sold by
Not Provided
Bought by
Dengiz Esma B
Home Financials for this Owner
Home Financials are based on the most recent Mortgage that was taken out on this home.
Original Mortgage
$244,800
Interest Rate
6.19%
Mortgage Type
New Conventional
Purchase Details
Closed on
Oct 15, 2004
Sold by
Weaver Grace J
Bought by
Horn Theodora and Horn George
Create a Home Valuation Report for This Property
The Home Valuation Report is an in-depth analysis detailing your home's value as well as a comparison with similar homes in the area
Home Values in the Area
Average Home Value in this Area
Purchase History
| Date | Buyer | Sale Price | Title Company |
|---|---|---|---|
| Dengiz Esma B | -- | -- | |
| Dengiz Esma B | $306,000 | -- | |
| Dengiz Esma B | $306,000 | -- | |
| Horn Theodora | $190,000 | -- |
Source: Public Records
Mortgage History
| Date | Status | Borrower | Loan Amount |
|---|---|---|---|
| Previous Owner | Dengiz Esma B | $244,800 | |
| Previous Owner | Dengiz Esma B | $30,600 |
Source: Public Records
Tax History
| Year | Tax Paid | Tax Assessment Tax Assessment Total Assessment is a certain percentage of the fair market value that is determined by local assessors to be the total taxable value of land and additions on the property. | Land | Improvement |
|---|---|---|---|---|
| 2025 | $2,993 | $175,880 | $44,000 | $131,880 |
| 2024 | $24 | $167,720 | $44,000 | $123,720 |
| 2023 | $1,256 | $137,320 | $30,000 | $107,320 |
| 2022 | $4,143 | $126,880 | $30,000 | $96,880 |
| 2021 | $4,054 | $105,480 | $20,000 | $85,480 |
| 2020 | $2,761 | $104,920 | $20,000 | $84,920 |
| 2019 | $4,077 | $105,440 | $20,000 | $85,440 |
| 2018 | $3,944 | $96,520 | $20,000 | $76,520 |
| 2017 | $3,088 | $81,720 | $17,440 | $64,280 |
| 2016 | $2,068 | $77,200 | $17,440 | $59,760 |
| 2015 | $3,131 | $79,480 | $17,440 | $62,040 |
| 2014 | $4,204 | $80,960 | $0 | $0 |
Source: Public Records
Map
Nearby Homes
Your Personal Tour Guide
Ask me questions while you tour the home.