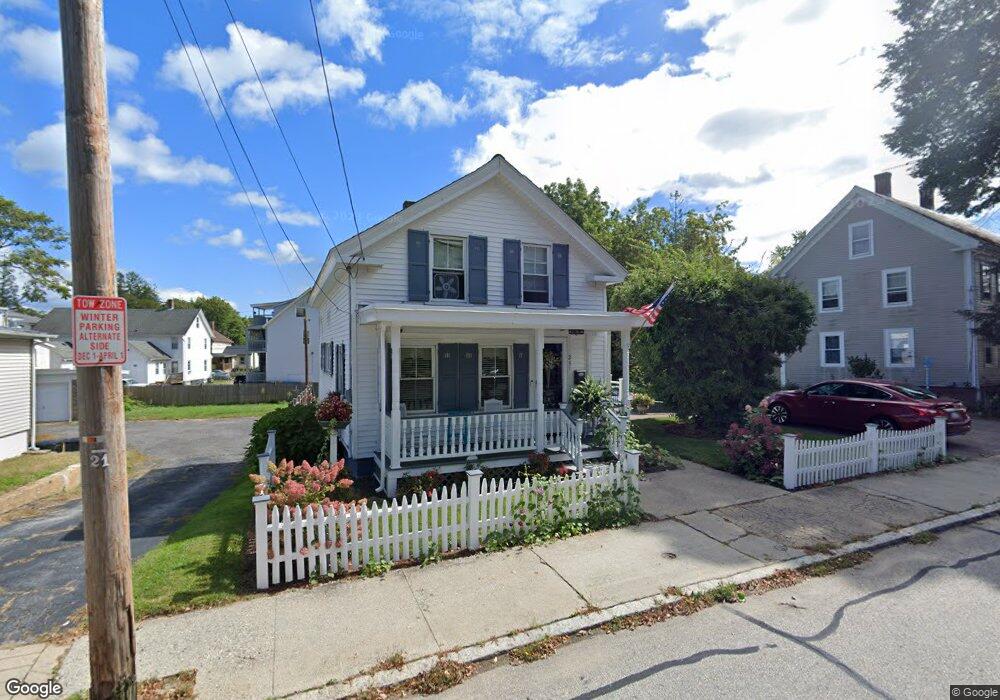
231 Elm St Southbridge, MA 01550
Estimated Value: $296,000 - $356,000
3
Beds
1
Bath
1,240
Sq Ft
$263/Sq Ft
Est. Value
About This Home
This home is located at 231 Elm St, Southbridge, MA 01550 and is currently estimated at $325,909, approximately $262 per square foot. 231 Elm St is a home located in Worcester County with nearby schools including Trinity Catholic Academy and ViewPoint Christian Academy.
Ownership History
Date
Name
Owned For
Owner Type
Purchase Details
Closed on
Jun 6, 2023
Sold by
Morrill John F and Morrill Michelle S
Bought by
Morrill Ft and Remillard
Current Estimated Value
Purchase Details
Closed on
Jan 27, 1992
Sold by
Morrill Daniel and Morrill Philip
Bought by
Morrill John F and Morrill Michelle
Home Financials for this Owner
Home Financials are based on the most recent Mortgage that was taken out on this home.
Original Mortgage
$68,850
Interest Rate
8.45%
Mortgage Type
Purchase Money Mortgage
Create a Home Valuation Report for This Property
The Home Valuation Report is an in-depth analysis detailing your home's value as well as a comparison with similar homes in the area
Home Values in the Area
Average Home Value in this Area
Purchase History
| Date | Buyer | Sale Price | Title Company |
|---|---|---|---|
| Morrill Ft | -- | None Available | |
| Morrill Ft | -- | None Available | |
| Morrill John F | $68,000 | -- | |
| Morrill John F | $68,000 | -- |
Source: Public Records
Mortgage History
| Date | Status | Borrower | Loan Amount |
|---|---|---|---|
| Previous Owner | Morrill John F | $91,000 | |
| Previous Owner | Morrill John F | $86,250 | |
| Previous Owner | Morrill John F | $68,850 |
Source: Public Records
Tax History Compared to Growth
Tax History
| Year | Tax Paid | Tax Assessment Tax Assessment Total Assessment is a certain percentage of the fair market value that is determined by local assessors to be the total taxable value of land and additions on the property. | Land | Improvement |
|---|---|---|---|---|
| 2025 | $3,970 | $270,800 | $34,200 | $236,600 |
| 2024 | $4,010 | $262,800 | $28,500 | $234,300 |
| 2023 | $3,781 | $238,700 | $28,500 | $210,200 |
| 2022 | $3,564 | $199,100 | $24,300 | $174,800 |
| 2021 | $3,429 | $176,400 | $24,300 | $152,100 |
| 2020 | $3,689 | $159,400 | $24,300 | $135,100 |
| 2018 | $2,897 | $139,600 | $21,600 | $118,000 |
| 2017 | $2,567 | $124,800 | $21,600 | $103,200 |
| 2016 | $2,575 | $127,400 | $21,600 | $105,800 |
| 2015 | $2,398 | $117,800 | $21,600 | $96,200 |
| 2014 | $2,465 | $125,500 | $21,600 | $103,900 |
Source: Public Records
Map
Nearby Homes