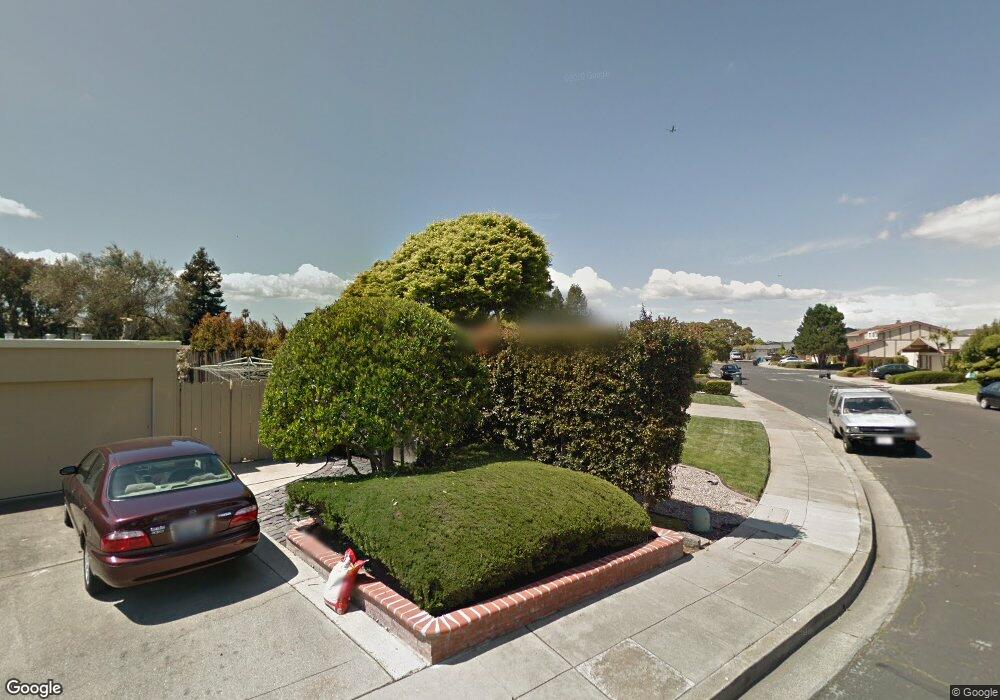
231 Loon Ct Foster City, CA 94404
Bay Vista NeighborhoodEstimated Value: $1,655,000 - $2,092,000
3
Beds
2
Baths
1,540
Sq Ft
$1,190/Sq Ft
Est. Value
About This Home
This home is located at 231 Loon Ct, Foster City, CA 94404 and is currently estimated at $1,833,046, approximately $1,190 per square foot. 231 Loon Ct is a home located in San Mateo County with nearby schools including Audubon Elementary School, Bowditch Middle School, and San Mateo High School.
Ownership History
Date
Name
Owned For
Owner Type
Purchase Details
Closed on
Oct 3, 2017
Sold by
Low Milton Jee and Low Ka Yi
Bought by
Low Milton Jee and Low Ka Yi
Current Estimated Value
Home Financials for this Owner
Home Financials are based on the most recent Mortgage that was taken out on this home.
Original Mortgage
$400,000
Outstanding Balance
$217,067
Interest Rate
3.78%
Mortgage Type
New Conventional
Estimated Equity
$1,615,979
Purchase Details
Closed on
Sep 3, 2013
Sold by
Low Milton Jee and Low Ka Yi
Bought by
Low Milton Jee and Low Ka Yi
Purchase Details
Closed on
Jun 7, 2000
Sold by
Jee Low Milton and Jee Lowe Wayson
Bought by
Low Milton Jee and Lee Kayi
Home Financials for this Owner
Home Financials are based on the most recent Mortgage that was taken out on this home.
Original Mortgage
$100,000
Interest Rate
8.15%
Mortgage Type
Stand Alone Second
Create a Home Valuation Report for This Property
The Home Valuation Report is an in-depth analysis detailing your home's value as well as a comparison with similar homes in the area
Home Values in the Area
Average Home Value in this Area
Purchase History
| Date | Buyer | Sale Price | Title Company |
|---|---|---|---|
| Low Milton Jee | -- | Chicago Title Company | |
| Low Milton Jee | -- | Chicago Title Company | |
| Low Milton Jee | -- | None Available | |
| Low Milton Jee | -- | None Available | |
| Low Milton Jee | -- | Fidelity National Title |
Source: Public Records
Mortgage History
| Date | Status | Borrower | Loan Amount |
|---|---|---|---|
| Open | Low Milton Jee | $400,000 | |
| Previous Owner | Low Milton Jee | $100,000 |
Source: Public Records
Tax History Compared to Growth
Tax History
| Year | Tax Paid | Tax Assessment Tax Assessment Total Assessment is a certain percentage of the fair market value that is determined by local assessors to be the total taxable value of land and additions on the property. | Land | Improvement |
|---|---|---|---|---|
| 2025 | $6,763 | $553,704 | $276,852 | $276,852 |
| 2023 | $6,763 | $532,204 | $266,102 | $266,102 |
| 2022 | $6,527 | $521,770 | $260,885 | $260,885 |
| 2021 | $6,436 | $511,540 | $255,770 | $255,770 |
| 2020 | $6,262 | $506,296 | $253,148 | $253,148 |
| 2019 | $5,941 | $496,370 | $248,185 | $248,185 |
| 2018 | $5,542 | $486,638 | $243,319 | $243,319 |
| 2017 | $5,479 | $477,098 | $238,549 | $238,549 |
| 2016 | $5,567 | $467,744 | $233,872 | $233,872 |
| 2015 | $5,437 | $460,720 | $230,360 | $230,360 |
| 2014 | $5,300 | $451,696 | $225,848 | $225,848 |
Source: Public Records
Map
Nearby Homes
- 224 Loon Ct
- 1351 Marlin Ave
- 1074 Eagle Ln
- 1336 Marlin Ave
- 275 Puffin Ct
- 748 Gull Ave
- 241 Bonita Ln
- 650 Pilgrim Dr
- 3206 Admiralty Ln
- 1102 Admiralty Ln
- 591 Pilgrim Dr
- 370 Bramble Ct
- 708 Thayer Ln Unit 404
- 769 Eppleton Ln Unit 302
- 1028 Foster Square Ln Unit 305
- 708 Eppleton Ln Unit 204
- 718 Eppleton Ln Unit 303
- 1131 Compass Ln Unit 108
- 1081 Beach Park Blvd Unit 206
- 1061 Beach Park Blvd Unit 216