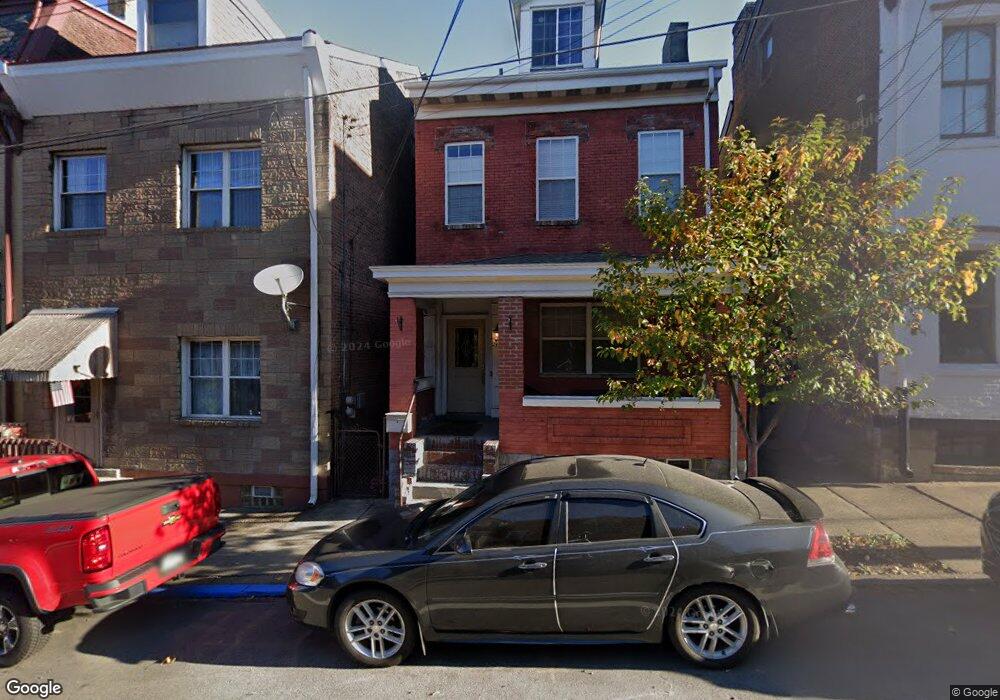
231 Main St Pittsburgh, PA 15201
Central Lawrenceville NeighborhoodEstimated Value: $237,000 - $524,000
4
Beds
2
Baths
1,912
Sq Ft
$192/Sq Ft
Est. Value
About This Home
This home is located at 231 Main St, Pittsburgh, PA 15201 and is currently estimated at $366,261, approximately $191 per square foot. 231 Main St is a home located in Allegheny County with nearby schools including Pittsburgh Arsenal K-5, Pittsburgh Arsenal 6-8, and Pittsburgh Milliones 6-12.
Ownership History
Date
Name
Owned For
Owner Type
Purchase Details
Closed on
Jun 1, 2007
Sold by
Szymanski Walter
Bought by
Anhalt Joshua T
Current Estimated Value
Home Financials for this Owner
Home Financials are based on the most recent Mortgage that was taken out on this home.
Original Mortgage
$85,600
Outstanding Balance
$52,520
Interest Rate
6.24%
Mortgage Type
New Conventional
Estimated Equity
$313,741
Purchase Details
Closed on
Feb 17, 1994
Sold by
Pijanowski Henrietta K and Czyzewski Henrietta
Bought by
Szymanski Walter
Create a Home Valuation Report for This Property
The Home Valuation Report is an in-depth analysis detailing your home's value as well as a comparison with similar homes in the area
Home Values in the Area
Average Home Value in this Area
Purchase History
| Date | Buyer | Sale Price | Title Company |
|---|---|---|---|
| Anhalt Joshua T | $107,000 | -- | |
| Szymanski Walter | $39,500 | -- |
Source: Public Records
Mortgage History
| Date | Status | Borrower | Loan Amount |
|---|---|---|---|
| Open | Anhalt Joshua T | $85,600 |
Source: Public Records
Tax History Compared to Growth
Tax History
| Year | Tax Paid | Tax Assessment Tax Assessment Total Assessment is a certain percentage of the fair market value that is determined by local assessors to be the total taxable value of land and additions on the property. | Land | Improvement |
|---|---|---|---|---|
| 2025 | $2,325 | $100,900 | $29,600 | $71,300 |
| 2024 | $2,325 | $100,900 | $29,600 | $71,300 |
| 2023 | $2,325 | $100,900 | $29,600 | $71,300 |
| 2022 | $2,294 | $100,900 | $29,600 | $71,300 |
| 2021 | $2,223 | $100,900 | $29,600 | $71,300 |
| 2020 | $2,283 | $100,900 | $29,600 | $71,300 |
| 2019 | $2,283 | $100,900 | $29,600 | $71,300 |
| 2018 | $1,739 | $100,900 | $29,600 | $71,300 |
| 2017 | $2,283 | $100,900 | $29,600 | $71,300 |
| 2016 | $477 | $100,900 | $29,600 | $71,300 |
| 2015 | $477 | $100,900 | $29,600 | $71,300 |
| 2014 | $2,233 | $100,900 | $29,600 | $71,300 |
Source: Public Records
Map
Nearby Homes