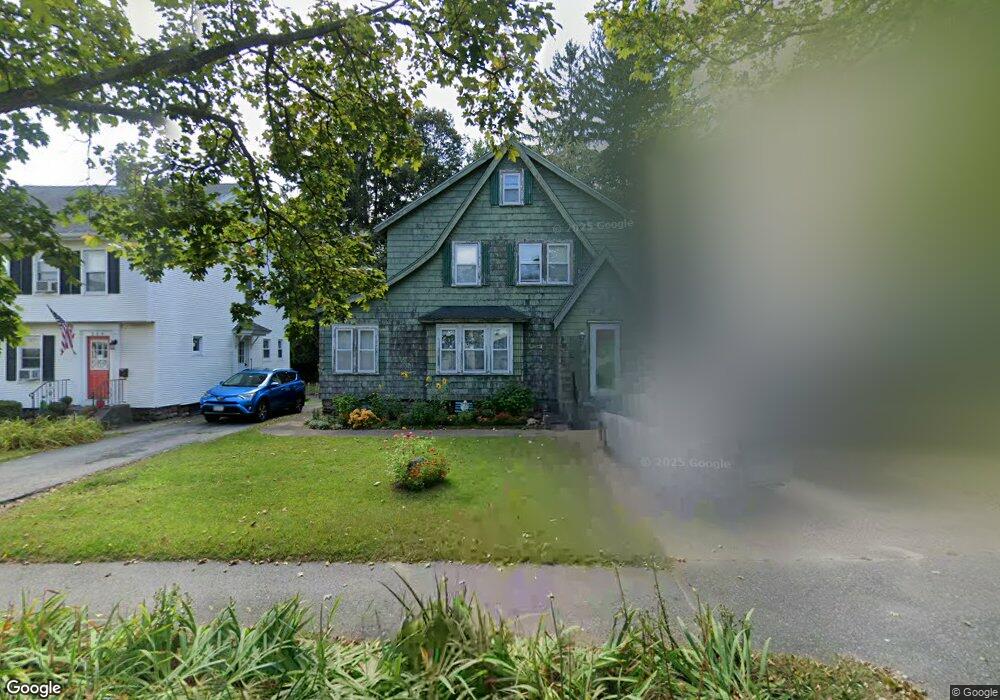
231 May St Worcester, MA 01602
Tatnuck NeighborhoodEstimated Value: $410,648 - $496,000
4
Beds
2
Baths
1,698
Sq Ft
$267/Sq Ft
Est. Value
About This Home
This home is located at 231 May St, Worcester, MA 01602 and is currently estimated at $452,662, approximately $266 per square foot. 231 May St is a home located in Worcester County with nearby schools including Chandler Magnet, Jacob Hiatt Magnet School, and May Street Elementary School.
Ownership History
Date
Name
Owned For
Owner Type
Purchase Details
Closed on
Aug 13, 2009
Sold by
Plymouth Pk Tax Svcs L
Bought by
Medina Marta
Current Estimated Value
Purchase Details
Closed on
Sep 30, 1996
Sold by
Tuccio Deborah D
Bought by
Medina Marta
Purchase Details
Closed on
Jul 29, 1993
Sold by
Est Francis L Jones and Tilton Sumner
Bought by
Tuccio Deborah
Create a Home Valuation Report for This Property
The Home Valuation Report is an in-depth analysis detailing your home's value as well as a comparison with similar homes in the area
Home Values in the Area
Average Home Value in this Area
Purchase History
| Date | Buyer | Sale Price | Title Company |
|---|---|---|---|
| Medina Marta | -- | -- | |
| Medina Marta | $75,000 | -- | |
| Tuccio Deborah | $75,000 | -- |
Source: Public Records
Mortgage History
| Date | Status | Borrower | Loan Amount |
|---|---|---|---|
| Open | Tuccio Deborah | $169,000 | |
| Previous Owner | Tuccio Deborah | $168,000 | |
| Previous Owner | Tuccio Deborah | $100,000 |
Source: Public Records
Tax History
| Year | Tax Paid | Tax Assessment Tax Assessment Total Assessment is a certain percentage of the fair market value that is determined by local assessors to be the total taxable value of land and additions on the property. | Land | Improvement |
|---|---|---|---|---|
| 2025 | $3,892 | $295,100 | $107,900 | $187,200 |
| 2024 | $3,842 | $279,400 | $107,900 | $171,500 |
| 2023 | $3,662 | $255,400 | $93,800 | $161,600 |
| 2022 | $3,346 | $220,000 | $75,100 | $144,900 |
| 2021 | $3,222 | $197,900 | $60,100 | $137,800 |
| 2020 | $3,145 | $185,000 | $60,100 | $124,900 |
| 2019 | $3,022 | $167,900 | $54,000 | $113,900 |
| 2018 | $3,022 | $159,800 | $54,000 | $105,800 |
| 2017 | $2,923 | $152,100 | $54,000 | $98,100 |
| 2016 | $2,859 | $138,700 | $40,900 | $97,800 |
| 2015 | $2,784 | $138,700 | $40,900 | $97,800 |
| 2014 | $2,710 | $138,700 | $40,900 | $97,800 |
Source: Public Records
Map
Nearby Homes
- 4 Hartshorn Ave
- 9 Fiske St Unit A
- 211 June St Unit 2
- 24 Hadwen Rd
- 33 Carlisle St
- 24 Geneva St
- 16 Sherwood Rd
- 28 Walworth St
- 60 June St
- 34 Rosslare Dr Unit 108
- 108 Longfellow Rd
- 18 Hadwen Ln
- 15 Longfellow Rd
- 10 Minthorne St
- 38 Glendale St
- 5 Franconia St
- 9 Englewood Ave
- 15 Circuit Ave E
- 114 Lovell St
- 19 Kenilworth Rd
Your Personal Tour Guide
Ask me questions while you tour the home.