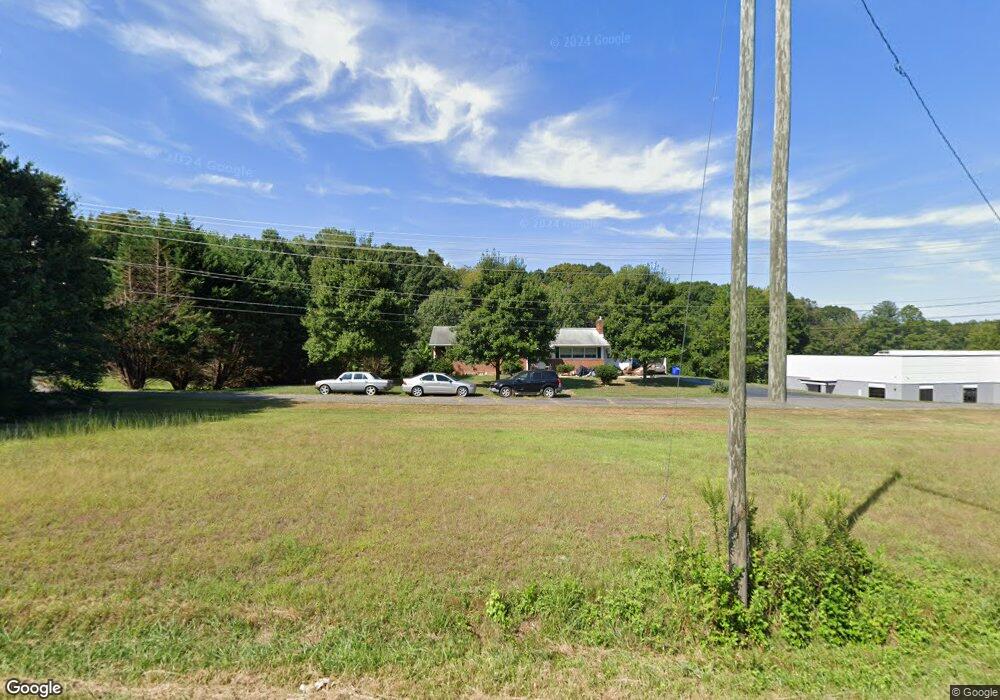
231 N Generals Blvd Lincolnton, NC 28092
--
Bed
--
Bath
6,345
Sq Ft
2.56
Acres
About This Home
This home is located at 231 N Generals Blvd, Lincolnton, NC 28092. 231 N Generals Blvd is a home located in Lincoln County with nearby schools including Battleground Elementary School, Lincolnton Middle School, and Lincolnton High School.
Ownership History
Date
Name
Owned For
Owner Type
Purchase Details
Closed on
Dec 28, 2020
Sold by
Carolina Eye Care Properties Llc
Bought by
Cec Property Investments Llc
Home Financials for this Owner
Home Financials are based on the most recent Mortgage that was taken out on this home.
Original Mortgage
$1,587,500
Outstanding Balance
$1,419,080
Interest Rate
2.8%
Mortgage Type
Construction
Purchase Details
Closed on
Sep 7, 2006
Sold by
Curits David L and Curtis Rachel Ann M
Bought by
Carolina Eye Care Properties Llc
Home Financials for this Owner
Home Financials are based on the most recent Mortgage that was taken out on this home.
Original Mortgage
$767,000
Interest Rate
6.58%
Mortgage Type
Commercial
Purchase Details
Closed on
Apr 13, 2005
Sold by
Spake Ricky J and Spake Susan L
Bought by
Jon Mar Llc
Purchase Details
Closed on
Nov 24, 2003
Bought by
Spake Ricky J
Create a Home Valuation Report for This Property
The Home Valuation Report is an in-depth analysis detailing your home's value as well as a comparison with similar homes in the area
Home Values in the Area
Average Home Value in this Area
Purchase History
| Date | Buyer | Sale Price | Title Company |
|---|---|---|---|
| Cec Property Investments Llc | -- | None Available | |
| Carolina Eye Care Properties Llc | -- | None Available | |
| Jon Mar Llc | $75,000 | None Available | |
| Spake Ricky J | $44,000 | -- |
Source: Public Records
Mortgage History
| Date | Status | Borrower | Loan Amount |
|---|---|---|---|
| Open | Cec Property Investments Llc | $1,587,500 | |
| Previous Owner | Carolina Eye Care Properties Llc | $767,000 |
Source: Public Records
Tax History Compared to Growth
Tax History
| Year | Tax Paid | Tax Assessment Tax Assessment Total Assessment is a certain percentage of the fair market value that is determined by local assessors to be the total taxable value of land and additions on the property. | Land | Improvement |
|---|---|---|---|---|
| 2025 | $19,452 | $1,933,093 | $440,390 | $1,492,703 |
| 2024 | $19,432 | $1,933,093 | $440,390 | $1,492,703 |
| 2023 | $19,427 | $1,933,093 | $440,390 | $1,492,703 |
| 2022 | $16,435 | $1,384,214 | $249,262 | $1,134,952 |
| 2021 | $9,897 | $829,694 | $249,262 | $580,432 |
| 2020 | $9,616 | $829,694 | $249,262 | $580,432 |
| 2019 | $9,616 | $829,694 | $249,262 | $580,432 |
| 2018 | $8,762 | $739,620 | $221,027 | $518,593 |
| 2017 | $8,661 | $739,620 | $221,027 | $518,593 |
| 2016 | $8,661 | $739,620 | $221,027 | $518,593 |
| 2015 | $8,574 | $739,620 | $221,027 | $518,593 |
| 2014 | $9,055 | $774,794 | $222,159 | $552,635 |
Source: Public Records
Map
Nearby Homes
- 111 Newcastle Ave
- 915 Danbrook Cir
- 110 W Pine St
- 519 N State St
- 528 Sherrill Ave
- 00 Roper Dr
- 826 E Alexander St
- 1024 Catawba St
- 815 N Laurel St
- 2350, 1912 N Aspen St
- 810 & 812 Lincoln St E Unit 810
- 423 N Cedar St
- 709 Catawba St
- 4100 Summey Trail
- Lot 51 Hares Way
- Lot 49 Hares Way
- Lot 50 Hares Way
- 0 Wilma Sigmon Rd Unit A CAR4306088
- 141 Mallory Tai Dr
- 316 N Government St
- 225 N Generals Blvd
- 303 Newcastle Ave
- 221 N Generals Blvd
- 311 Newcastle Ave
- 309 Newcastle Ave
- 315 Newcastle Ave
- 307 Newcastle Ave
- 313 Newcastle Ave
- 0000 Newcastle Ave Unit 15
- 302 Newcastle Ave
- 319 Newcastle Ave
- 321 Newcastle Ave
- 15 Newcastle Ave Unit 15
- 314 Newcastle Ave
- 316 Newcastle Ave
- 310 Newcastle Ave
- 306 Newcastle Ave
- 318 Newcastle Ave
- 308 Newcastle Ave
- 320 Newcastle Ave