Estimated Value: $469,000 - $487,000
--
Bed
--
Bath
2,321
Sq Ft
$207/Sq Ft
Est. Value
About This Home
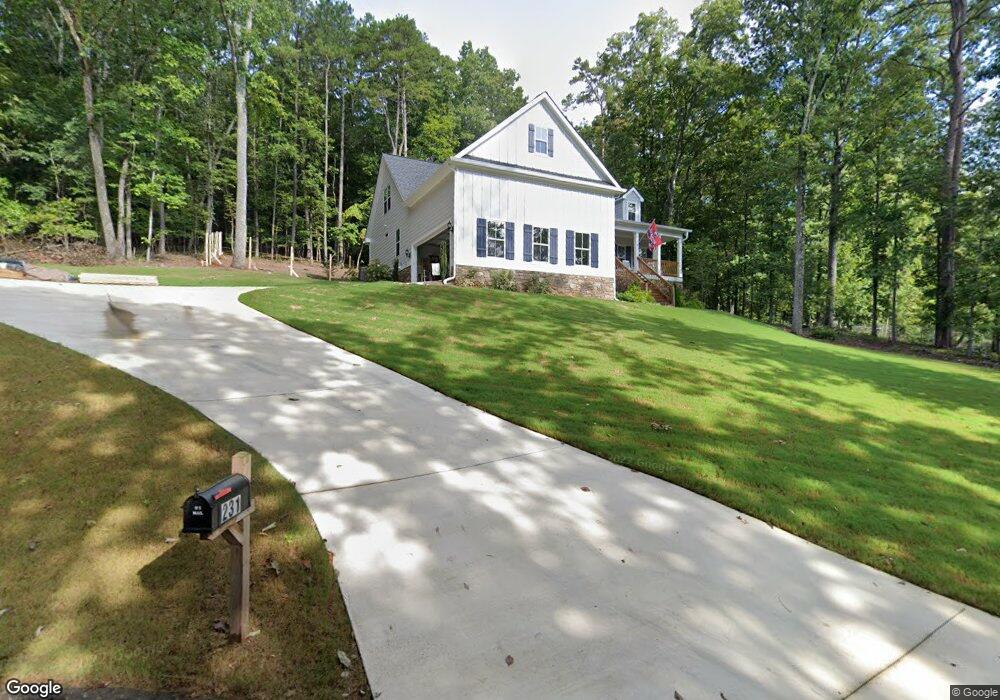
This home is located at 231 Pheasant Run SE Unit 115, Rome, GA 30161 and is currently estimated at $479,492, approximately $206 per square foot. 231 Pheasant Run SE Unit 115 is a home located in Floyd County with nearby schools including Dan McCarty Middle School, Rome High School, and Montessori School of Rome.
Ownership History
Date
Name
Owned For
Owner Type
Purchase Details
Closed on
Feb 28, 2025
Sold by
Hastings Pamela Lynn
Bought by
Briggs Brenda and Briggs Stephen
Current Estimated Value
Purchase Details
Closed on
Jun 25, 2021
Sold by
Childs Dan
Bought by
Hastings Pamela Lynn and Hastings Kevin Eugene
Home Financials for this Owner
Home Financials are based on the most recent Mortgage that was taken out on this home.
Original Mortgage
$295,920
Interest Rate
2.9%
Mortgage Type
New Conventional
Purchase Details
Closed on
Dec 30, 2020
Sold by
Childs & Fountain Investments Llc
Bought by
Childs Dan
Purchase Details
Closed on
Jan 26, 2017
Sold by
Tracey L
Bought by
Childs & Fountain Investments
Purchase Details
Closed on
Oct 7, 2015
Sold by
Davis Clyde R
Bought by
Montz Tracey L
Purchase Details
Closed on
Feb 2, 1978
Sold by
N R S Properties Inc
Bought by
Davis Clyde R and Davis Sara R
Purchase Details
Closed on
Jan 30, 1973
Bought by
N R S Properties Inc
Create a Home Valuation Report for This Property
The Home Valuation Report is an in-depth analysis detailing your home's value as well as a comparison with similar homes in the area
Home Values in the Area
Average Home Value in this Area
Purchase History
| Date | Buyer | Sale Price | Title Company |
|---|---|---|---|
| Briggs Brenda | $472,500 | -- | |
| Hastings Pamela Lynn | $369,900 | -- | |
| Childs Dan | -- | -- | |
| Childs & Fountain Investments | $7,500 | -- | |
| Montz Tracey L | -- | -- | |
| Davis Clyde R | $35,000 | -- | |
| N R S Properties Inc | -- | -- |
Source: Public Records
Mortgage History
| Date | Status | Borrower | Loan Amount |
|---|---|---|---|
| Previous Owner | Hastings Pamela Lynn | $295,920 |
Source: Public Records
Tax History Compared to Growth
Tax History
| Year | Tax Paid | Tax Assessment Tax Assessment Total Assessment is a certain percentage of the fair market value that is determined by local assessors to be the total taxable value of land and additions on the property. | Land | Improvement |
|---|---|---|---|---|
| 2024 | $6,794 | $192,781 | $32,338 | $160,443 |
| 2023 | $6,732 | $190,116 | $28,934 | $161,182 |
| 2022 | $5,399 | $158,214 | $23,828 | $134,386 |
| 2021 | $821 | $22,126 | $22,126 | $0 |
| 2020 | $637 | $17,020 | $17,020 | $0 |
| 2019 | $630 | $17,020 | $17,020 | $0 |
| 2018 | $111 | $17,020 | $17,020 | $0 |
| 2017 | $630 | $17,020 | $17,020 | $0 |
| 2016 | $631 | $17,000 | $17,000 | $0 |
| 2015 | -- | $17,000 | $17,000 | $0 |
| 2014 | -- | $17,000 | $17,000 | $0 |
Source: Public Records
Map
Nearby Homes
- 409 Flora Ave SE
- 36 Saddle Mountain Rd SE
- 2812 Maple Rd SE
- 226 Flora Ave SE
- 3014 Maple Rd SE
- 211 Alfred Ave SE
- 212 Alfred Ave SE
- 2710 Maple Rd SE
- 27 Saddle Mountain Rd SE
- 3 Belmont Ct SE
- 2523 Maple Rd SE
- 15 Saddlebrook Dr SE
- 33 Summit Dr
- 52 Twickenham Rd SE
- 13 Spring Cir SE
- 2508 Maple Rd SE
- 2501 Maple Rd SE
- 26 Saddlebrook Dr SE
- 109 Chateau Dr SE
- 0 Wellington Way SE Unit 7374602
- 227 Pheasant Run SE
- 1 Wren Place SE
- 3 Wren Place SE
- 121 Saddle Mountain Rd SE
- 125 Saddle Mountain Rd SE
- 232 Pheasant Run SE
- 232 Pheasant Run SE
- 127 Saddle Mountain Rd SE
- 5 Wren Place SE
- 225 Pheasant Run SE
- 2 Wren Place SE
- 119 Saddle Mountain Rd SE
- 230 Pheasant Run SE
- 4 Wren Place SE
- 223 Pheasant Run SE
- 300 Pheasant Run SE
- 129 Saddle Mountain Rd SE
- 122 Saddle Mountain Rd SE
- 120 Saddle Mountain Rd SE
- 6 Wren Place SE