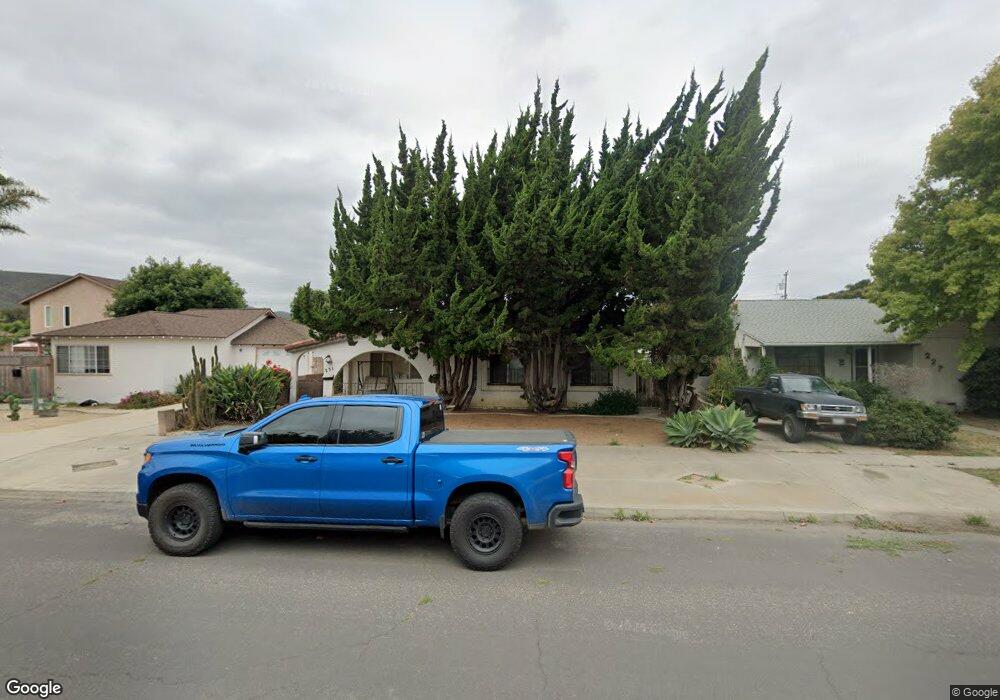
231 S E St Lompoc, CA 93436
Estimated Value: $569,213 - $614,000
3
Beds
2
Baths
1,528
Sq Ft
$391/Sq Ft
Est. Value
About This Home
This home is located at 231 S E St, Lompoc, CA 93436 and is currently estimated at $597,553, approximately $391 per square foot. 231 S E St is a home located in Santa Barbara County with nearby schools including Arthur Hapgood Elementary School, Lompoc Valley Middle School, and Lompoc High School.
Ownership History
Date
Name
Owned For
Owner Type
Purchase Details
Closed on
Nov 20, 2017
Sold by
Laflamme Marie Lorraine
Bought by
Lane George David
Current Estimated Value
Purchase Details
Closed on
Oct 30, 2017
Sold by
Laflamme Marie Lorraine
Bought by
Laflamme Marie Lorraine
Purchase Details
Closed on
Sep 29, 2010
Sold by
Brickner Dale Anthony
Bought by
Brickner Dale Anthony
Purchase Details
Closed on
Jul 11, 1996
Sold by
Romero Dorothy Marie
Bought by
Brickner Dale Anthony
Home Financials for this Owner
Home Financials are based on the most recent Mortgage that was taken out on this home.
Original Mortgage
$60,000
Interest Rate
10.75%
Create a Home Valuation Report for This Property
The Home Valuation Report is an in-depth analysis detailing your home's value as well as a comparison with similar homes in the area
Home Values in the Area
Average Home Value in this Area
Purchase History
| Date | Buyer | Sale Price | Title Company |
|---|---|---|---|
| Lane George David | -- | None Available | |
| Laflamme Marie Lorraine | -- | None Available | |
| Brickner Dale Anthony | -- | None Available | |
| Brickner Dale Anthony | $40,000 | First American Title |
Source: Public Records
Mortgage History
| Date | Status | Borrower | Loan Amount |
|---|---|---|---|
| Previous Owner | Brickner Dale Anthony | $60,000 |
Source: Public Records
Tax History Compared to Growth
Tax History
| Year | Tax Paid | Tax Assessment Tax Assessment Total Assessment is a certain percentage of the fair market value that is determined by local assessors to be the total taxable value of land and additions on the property. | Land | Improvement |
|---|---|---|---|---|
| 2025 | $4,478 | $417,804 | $104,449 | $313,355 |
| 2023 | $4,478 | $401,582 | $100,394 | $301,188 |
| 2022 | $4,398 | $393,709 | $98,426 | $295,283 |
| 2021 | $4,446 | $385,991 | $96,497 | $289,494 |
| 2020 | $4,397 | $382,034 | $95,508 | $286,526 |
| 2019 | $4,324 | $374,544 | $93,636 | $280,908 |
| 2018 | $4,338 | $367,200 | $91,800 | $275,400 |
| 2017 | $2,048 | $171,211 | $56,419 | $114,792 |
| 2016 | $2,011 | $167,855 | $55,313 | $112,542 |
| 2014 | $1,968 | $162,097 | $53,416 | $108,681 |
Source: Public Records
Map
Nearby Homes