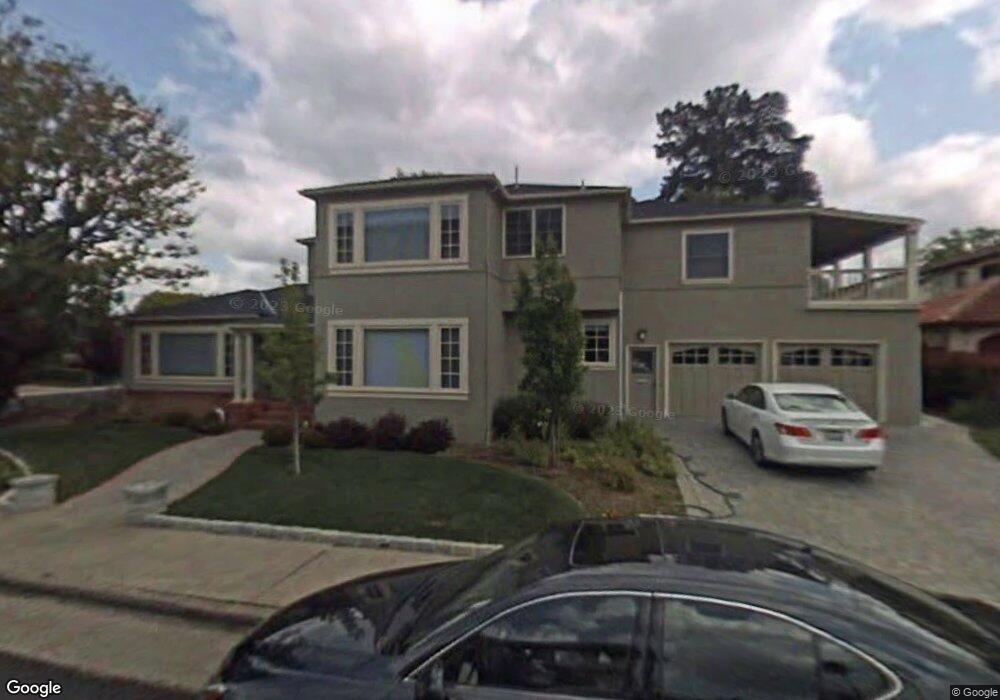
231 W 5th Ave Unit W San Mateo, CA 94402
Baywood-Aragon NeighborhoodEstimated Value: $1,291,000 - $3,082,116
3
Beds
3
Baths
2,550
Sq Ft
$973/Sq Ft
Est. Value
About This Home
This home is located at 231 W 5th Ave Unit W, San Mateo, CA 94402 and is currently estimated at $2,480,779, approximately $972 per square foot. 231 W 5th Ave Unit W is a home located in San Mateo County with nearby schools including Baywood Elementary School, Borel Middle School, and Aragon High School.
Ownership History
Date
Name
Owned For
Owner Type
Purchase Details
Closed on
Mar 31, 2025
Sold by
Rodinsky M Carole M and Rodinsky Robert Bernon
Bought by
Robert Bernon Rodinsky And Mary Carole Rodins and Rodinsky
Current Estimated Value
Purchase Details
Closed on
Aug 4, 2011
Sold by
Michaud Terry A and Michaud Lucia
Bought by
Medrano Tyrone M and Medrano Courtney
Home Financials for this Owner
Home Financials are based on the most recent Mortgage that was taken out on this home.
Original Mortgage
$395,000
Interest Rate
4.46%
Mortgage Type
Seller Take Back
Purchase Details
Closed on
Sep 7, 1995
Sold by
Richter Harold and Torre Marie S
Bought by
Rodinsky Robert B and Rodinsky Carole Rodinsky
Home Financials for this Owner
Home Financials are based on the most recent Mortgage that was taken out on this home.
Original Mortgage
$394,700
Interest Rate
7.97%
Create a Home Valuation Report for This Property
The Home Valuation Report is an in-depth analysis detailing your home's value as well as a comparison with similar homes in the area
Home Values in the Area
Average Home Value in this Area
Purchase History
| Date | Buyer | Sale Price | Title Company |
|---|---|---|---|
| Robert Bernon Rodinsky And Mary Carole Rodins | -- | None Listed On Document | |
| Medrano Tyrone M | $196,500 | North American Title Co Inc | |
| Rodinsky Robert B | $494,000 | Chicago Title Co |
Source: Public Records
Mortgage History
| Date | Status | Borrower | Loan Amount |
|---|---|---|---|
| Previous Owner | Medrano Tyrone M | $395,000 | |
| Previous Owner | Rodinsky Robert B | $394,700 |
Source: Public Records
Tax History
| Year | Tax Paid | Tax Assessment Tax Assessment Total Assessment is a certain percentage of the fair market value that is determined by local assessors to be the total taxable value of land and additions on the property. | Land | Improvement |
|---|---|---|---|---|
| 2025 | $10,676 | $819,603 | $409,801 | $409,802 |
| 2023 | $10,676 | $787,779 | $393,889 | $393,890 |
| 2022 | $10,489 | $772,333 | $386,166 | $386,167 |
| 2021 | $9,996 | $757,191 | $378,595 | $378,596 |
| 2020 | $9,676 | $749,427 | $374,713 | $374,714 |
| 2019 | $9,350 | $734,733 | $367,366 | $367,367 |
| 2018 | $8,843 | $720,327 | $360,163 | $360,164 |
| 2017 | $8,393 | $706,203 | $353,101 | $353,102 |
| 2016 | $8,434 | $692,357 | $346,178 | $346,179 |
| 2015 | $8,214 | $681,959 | $340,979 | $340,980 |
| 2014 | $8,171 | $668,601 | $334,300 | $334,301 |
Source: Public Records
Map
Nearby Homes
- 225 Virginia Ave Unit PH-D
- 523 Maple St
- 141 W 3rd Ave
- 212 Eaton Rd Unit 1
- 370 Parrott Dr
- 30 Mission Dr
- 20 W 3rd Ave Unit 202
- 250 Harvard Rd
- 307 Aragon Blvd
- 10 Crystal Springs Rd Unit 1202
- 10 Crystal Springs Rd Unit 1509
- 10 Crystal Springs Rd Unit 1206
- 10 Crystal Springs Rd Unit 1405
- 10 Crystal Springs Rd Unit 1310
- 10 Crystal Springs Rd Unit 2214
- 10 9th Ave Unit 107
- 11 Hayward Ave Unit 1009
- 555 Laurel Ave Unit 614
- 22 De Sabla Rd
- 1 Baldwin Ave Unit 903
- 508 Alhambra Rd
- 253 Virginia Ave
- 514 Alhambra Rd
- 230 W 5th Ave Unit 303
- 230 W 5th Ave Unit 201
- 230 W 5th Ave Unit 402
- 230 W 5th Ave Unit 203
- 230 W 5th Ave Unit 104
- 230 W 5th Ave Unit 202
- 230 W 5th Ave Unit 204
- 230 W 5th Ave Unit 404
- 230 W 5th Ave
- 230 W 5th Ave Unit 401
- 230 W 5th Ave Unit 302
- 230 W 5th Ave Unit W
- 230 W 5th Ave Unit W
- 230 W 5th Ave Unit W
- 230 W 5th Ave Unit W
- 230 W 5th Ave Unit W
- 230 W 5th Ave Unit W
Your Personal Tour Guide
Ask me questions while you tour the home.