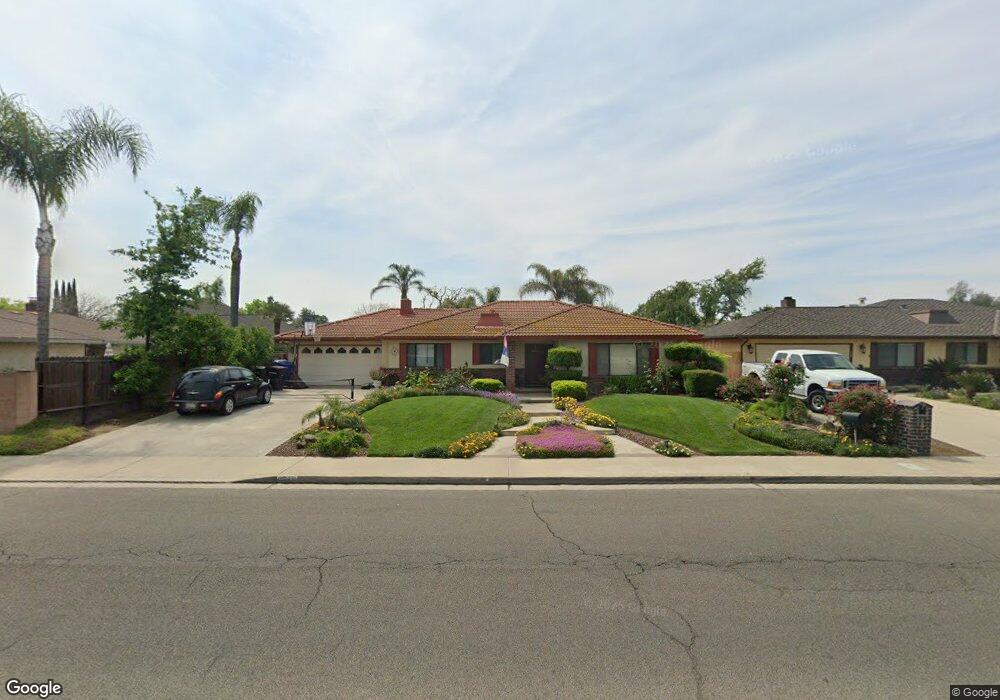
231 W Fargo Ave Hanford, CA 93230
Estimated Value: $373,433 - $392,000
3
Beds
2
Baths
1,775
Sq Ft
$217/Sq Ft
Est. Value
About This Home
This home is located at 231 W Fargo Ave, Hanford, CA 93230 and is currently estimated at $385,358, approximately $217 per square foot. 231 W Fargo Ave is a home located in Kings County with nearby schools including Monroe Elementary School, Woodrow Wilson Junior High School, and Hanford High School.
Ownership History
Date
Name
Owned For
Owner Type
Purchase Details
Closed on
Feb 5, 2020
Sold by
Fialho Roy M
Bought by
Ramos Cecilia
Current Estimated Value
Home Financials for this Owner
Home Financials are based on the most recent Mortgage that was taken out on this home.
Original Mortgage
$55,000
Outstanding Balance
$48,828
Interest Rate
3.74%
Mortgage Type
New Conventional
Estimated Equity
$336,530
Purchase Details
Closed on
Jan 29, 2020
Sold by
Fialho Roy M
Bought by
Ramos Cecilia
Home Financials for this Owner
Home Financials are based on the most recent Mortgage that was taken out on this home.
Original Mortgage
$55,000
Outstanding Balance
$48,828
Interest Rate
3.74%
Mortgage Type
New Conventional
Estimated Equity
$336,530
Purchase Details
Closed on
Dec 29, 2014
Sold by
Fialho Yi
Bought by
Fialho Roy M
Purchase Details
Closed on
Dec 17, 2014
Sold by
Ramos John
Bought by
Ramos Cecilia
Purchase Details
Closed on
Jan 22, 2010
Sold by
Fialho Manuel G and Fialho Idalina
Bought by
Fialho Manuel G and Fialho Idalina
Create a Home Valuation Report for This Property
The Home Valuation Report is an in-depth analysis detailing your home's value as well as a comparison with similar homes in the area
Home Values in the Area
Average Home Value in this Area
Purchase History
| Date | Buyer | Sale Price | Title Company |
|---|---|---|---|
| Ramos Cecilia | -- | Chicago Title | |
| Ramos Cecilia | -- | Chicago Title | |
| Fialho Roy M | -- | None Available | |
| Ramos Cecilia | -- | None Available | |
| Fialho Roy M | -- | None Available | |
| Fialho Manuel G | -- | None Available |
Source: Public Records
Mortgage History
| Date | Status | Borrower | Loan Amount |
|---|---|---|---|
| Open | Ramos Cecilia | $55,000 | |
| Closed | Ramos Cecilia | $55,000 |
Source: Public Records
Tax History Compared to Growth
Tax History
| Year | Tax Paid | Tax Assessment Tax Assessment Total Assessment is a certain percentage of the fair market value that is determined by local assessors to be the total taxable value of land and additions on the property. | Land | Improvement |
|---|---|---|---|---|
| 2025 | $2,210 | $215,388 | $56,323 | $159,065 |
| 2023 | $2,210 | $207,027 | $54,137 | $152,890 |
| 2022 | $2,161 | $202,969 | $53,076 | $149,893 |
| 2021 | $2,113 | $198,990 | $52,036 | $146,954 |
| 2020 | $1,796 | $159,798 | $28,003 | $131,795 |
| 2019 | $1,766 | $156,665 | $27,454 | $129,211 |
| 2018 | $1,715 | $153,593 | $26,916 | $126,677 |
| 2017 | $1,689 | $150,581 | $26,388 | $124,193 |
| 2016 | $1,667 | $147,629 | $25,871 | $121,758 |
| 2015 | $1,657 | $145,411 | $25,482 | $119,929 |
| 2014 | $1,624 | $142,563 | $24,983 | $117,580 |
Source: Public Records
Map
Nearby Homes
- 314 W Birch Ave
- 2396 Cabrillo Way
- 2352 Cabrillo Way
- 165 W Magnolia Ave
- 2612 Aspen St
- 2475 Santa Lucia Ct
- 332 E Ash Ave
- 2234 Carter Way
- 2210 N Douty St
- 216 Palm Ct
- 496 W Earl Way
- 325 E Amber Way
- 450 E Birch Ave
- 405 E Magnolia Ave
- 2851 Julia Cir
- 710 Northstar Dr
- 850 Northstar Dr
- 259 E Sherwood Dr
- 594 Diana Ct
- 247 W Fargo Ave
- 2478 Carter Way
- 216 W Ash Ave
- 2490 Carter Way
- 265 W Fargo Ave
- 2466 Carter Way
- 230 W Ash Ave
- 232 W Fargo Ave
- 248 W Fargo Ave
- 242 W Ash Ave
- 2504 Carter Way
- 266 W Fargo Ave
- 283 W Fargo Ave
- 175 W Fargo Ave
- 274 W Ash Ave
- 2520 Carter Way
- 229 W Ash Ave
- 241 W Ash Ave
- 2479 Carter Way
- 284 W Fargo Ave