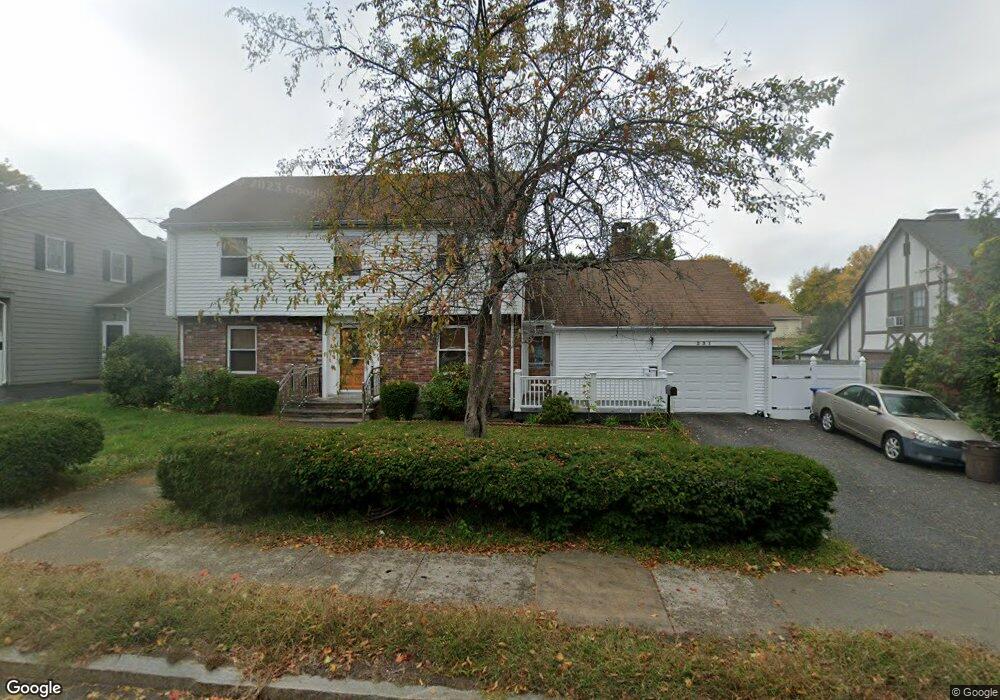
231 Waltham St West Newton, MA 02465
West Newton NeighborhoodEstimated Value: $1,357,000 - $1,524,532
5
Beds
4
Baths
2,782
Sq Ft
$519/Sq Ft
Est. Value
About This Home
This home is located at 231 Waltham St, West Newton, MA 02465 and is currently estimated at $1,443,633, approximately $518 per square foot. 231 Waltham St is a home located in Middlesex County with nearby schools including Franklin Elementary School, F.A. Day Middle School, and Newton North High School.
Ownership History
Date
Name
Owned For
Owner Type
Purchase Details
Closed on
Aug 26, 2025
Sold by
Wu Quan Y
Bought by
Wong Melissa
Current Estimated Value
Purchase Details
Closed on
Jul 23, 2008
Sold by
Chin Paul and Wu Quan Ying
Bought by
Chin Paul and Wu Quan Ying
Purchase Details
Closed on
Feb 26, 2001
Sold by
Labrecque Michelle S
Bought by
Chin Paul and Wu Quan Ying
Home Financials for this Owner
Home Financials are based on the most recent Mortgage that was taken out on this home.
Original Mortgage
$373,600
Interest Rate
6.89%
Mortgage Type
Purchase Money Mortgage
Purchase Details
Closed on
Apr 10, 1989
Sold by
Heritage Rt
Bought by
Labrecque Michelle S
Create a Home Valuation Report for This Property
The Home Valuation Report is an in-depth analysis detailing your home's value as well as a comparison with similar homes in the area
Home Values in the Area
Average Home Value in this Area
Purchase History
| Date | Buyer | Sale Price | Title Company |
|---|---|---|---|
| Wong Melissa | -- | -- | |
| Wong Melissa | -- | -- | |
| Chin Paul | -- | -- | |
| Chin Paul | -- | -- | |
| Chin Paul | $467,000 | -- | |
| Labrecque Michelle S | $305,000 | -- | |
| Labrecque Michelle S | $305,000 | -- |
Source: Public Records
Mortgage History
| Date | Status | Borrower | Loan Amount |
|---|---|---|---|
| Previous Owner | Labrecque Michelle S | $373,600 | |
| Previous Owner | Labrecque Michelle S | $50,000 | |
| Previous Owner | Labrecque Michelle S | $45,000 |
Source: Public Records
Tax History Compared to Growth
Tax History
| Year | Tax Paid | Tax Assessment Tax Assessment Total Assessment is a certain percentage of the fair market value that is determined by local assessors to be the total taxable value of land and additions on the property. | Land | Improvement |
|---|---|---|---|---|
| 2025 | $11,977 | $1,222,100 | $801,000 | $421,100 |
| 2024 | $11,329 | $1,160,800 | $777,700 | $383,100 |
| 2023 | $10,866 | $1,067,400 | $590,300 | $477,100 |
| 2022 | $10,397 | $988,300 | $546,600 | $441,700 |
| 2021 | $10,033 | $932,400 | $515,700 | $416,700 |
| 2020 | $9,734 | $932,400 | $515,700 | $416,700 |
| 2019 | $9,459 | $905,200 | $500,700 | $404,500 |
| 2018 | $9,084 | $839,600 | $452,600 | $387,000 |
| 2017 | $8,808 | $792,100 | $427,000 | $365,100 |
| 2016 | $8,425 | $740,300 | $399,100 | $341,200 |
| 2015 | $8,033 | $691,900 | $373,000 | $318,900 |
Source: Public Records
Map
Nearby Homes
- 76 Harding St
- 76 Taft Ave Unit 1
- 76 Taft Ave
- 76 Taft Ave Unit 2
- 75 Cherry St
- 41 Kilburn Rd
- 33 Joseph Rd
- 287 Cherry St Unit 2
- 321 Albemarle Rd
- 11 Randlett Park
- 56 Dearborn St
- 44 Westland Ave
- 9 John St
- 1 Farwell Cir
- 162 Myrtle St Unit 1
- 14 Cottage Place Unit 14
- 138 Myrtle St Unit 2
- 24 Tolman St Unit A
- 27 Cross St Unit 27
- 354 Linwood Ave Unit 1