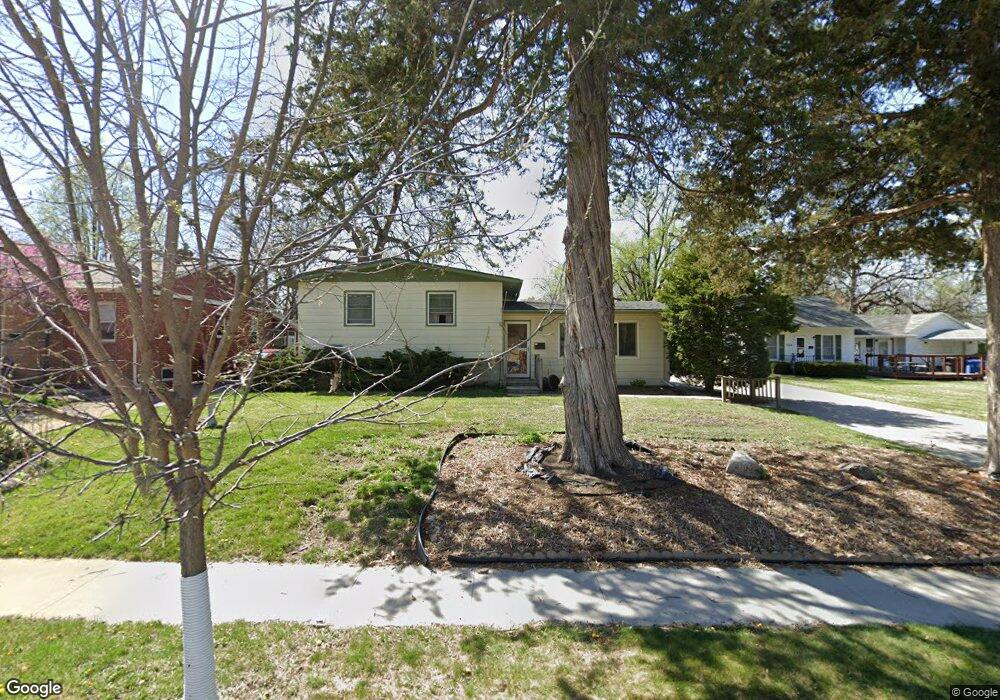
2310 37th St Des Moines, IA 50310
Beaverdale NeighborhoodEstimated Value: $229,000 - $247,000
3
Beds
2
Baths
1,016
Sq Ft
$235/Sq Ft
Est. Value
About This Home
This home is located at 2310 37th St, Des Moines, IA 50310 and is currently estimated at $239,193, approximately $235 per square foot. 2310 37th St is a home located in Polk County with nearby schools including Monroe Elementary School, Meredith Middle School, and Hoover High School.
Ownership History
Date
Name
Owned For
Owner Type
Purchase Details
Closed on
Dec 1, 2006
Sold by
Foundation For The Challenged
Bought by
Ffc Housing Tennessee
Current Estimated Value
Home Financials for this Owner
Home Financials are based on the most recent Mortgage that was taken out on this home.
Original Mortgage
$119,250
Outstanding Balance
$71,564
Interest Rate
6.47%
Mortgage Type
Purchase Money Mortgage
Estimated Equity
$167,629
Purchase Details
Closed on
Aug 28, 2006
Sold by
American Baptist Homes Of The Midwest
Bought by
Foundation For The Challenged
Home Financials for this Owner
Home Financials are based on the most recent Mortgage that was taken out on this home.
Original Mortgage
$118,800
Interest Rate
6.77%
Mortgage Type
Purchase Money Mortgage
Create a Home Valuation Report for This Property
The Home Valuation Report is an in-depth analysis detailing your home's value as well as a comparison with similar homes in the area
Home Values in the Area
Average Home Value in this Area
Purchase History
| Date | Buyer | Sale Price | Title Company |
|---|---|---|---|
| Ffc Housing Tennessee | -- | Landam | |
| Foundation For The Challenged | $132,000 | None Available |
Source: Public Records
Mortgage History
| Date | Status | Borrower | Loan Amount |
|---|---|---|---|
| Open | Ffc Housing Tennessee | $119,250 | |
| Previous Owner | Foundation For The Challenged | $118,800 |
Source: Public Records
Tax History Compared to Growth
Tax History
| Year | Tax Paid | Tax Assessment Tax Assessment Total Assessment is a certain percentage of the fair market value that is determined by local assessors to be the total taxable value of land and additions on the property. | Land | Improvement |
|---|---|---|---|---|
| 2025 | $4,280 | $237,200 | $52,500 | $184,700 |
| 2024 | $4,280 | $217,600 | $47,600 | $170,000 |
| 2023 | $4,292 | $217,600 | $47,600 | $170,000 |
| 2022 | $4,260 | $182,100 | $41,100 | $141,000 |
| 2021 | $4,168 | $182,100 | $41,100 | $141,000 |
| 2020 | $4,330 | $167,000 | $37,600 | $129,400 |
| 2019 | $4,004 | $167,000 | $37,600 | $129,400 |
| 2018 | $3,964 | $149,000 | $32,900 | $116,100 |
| 2017 | $3,652 | $149,000 | $32,900 | $116,100 |
| 2016 | $3,558 | $135,000 | $29,400 | $105,600 |
| 2015 | $3,558 | $135,000 | $29,400 | $105,600 |
| 2014 | $3,498 | $136,600 | $29,200 | $107,400 |
Source: Public Records
Map
Nearby Homes